29
/es/
es
AIzaSyAYiBZKx7MnpbEhh9jyipgxe19OcubqV5w
April 1, 2024
114884
Croatia
HRV
true
2
1
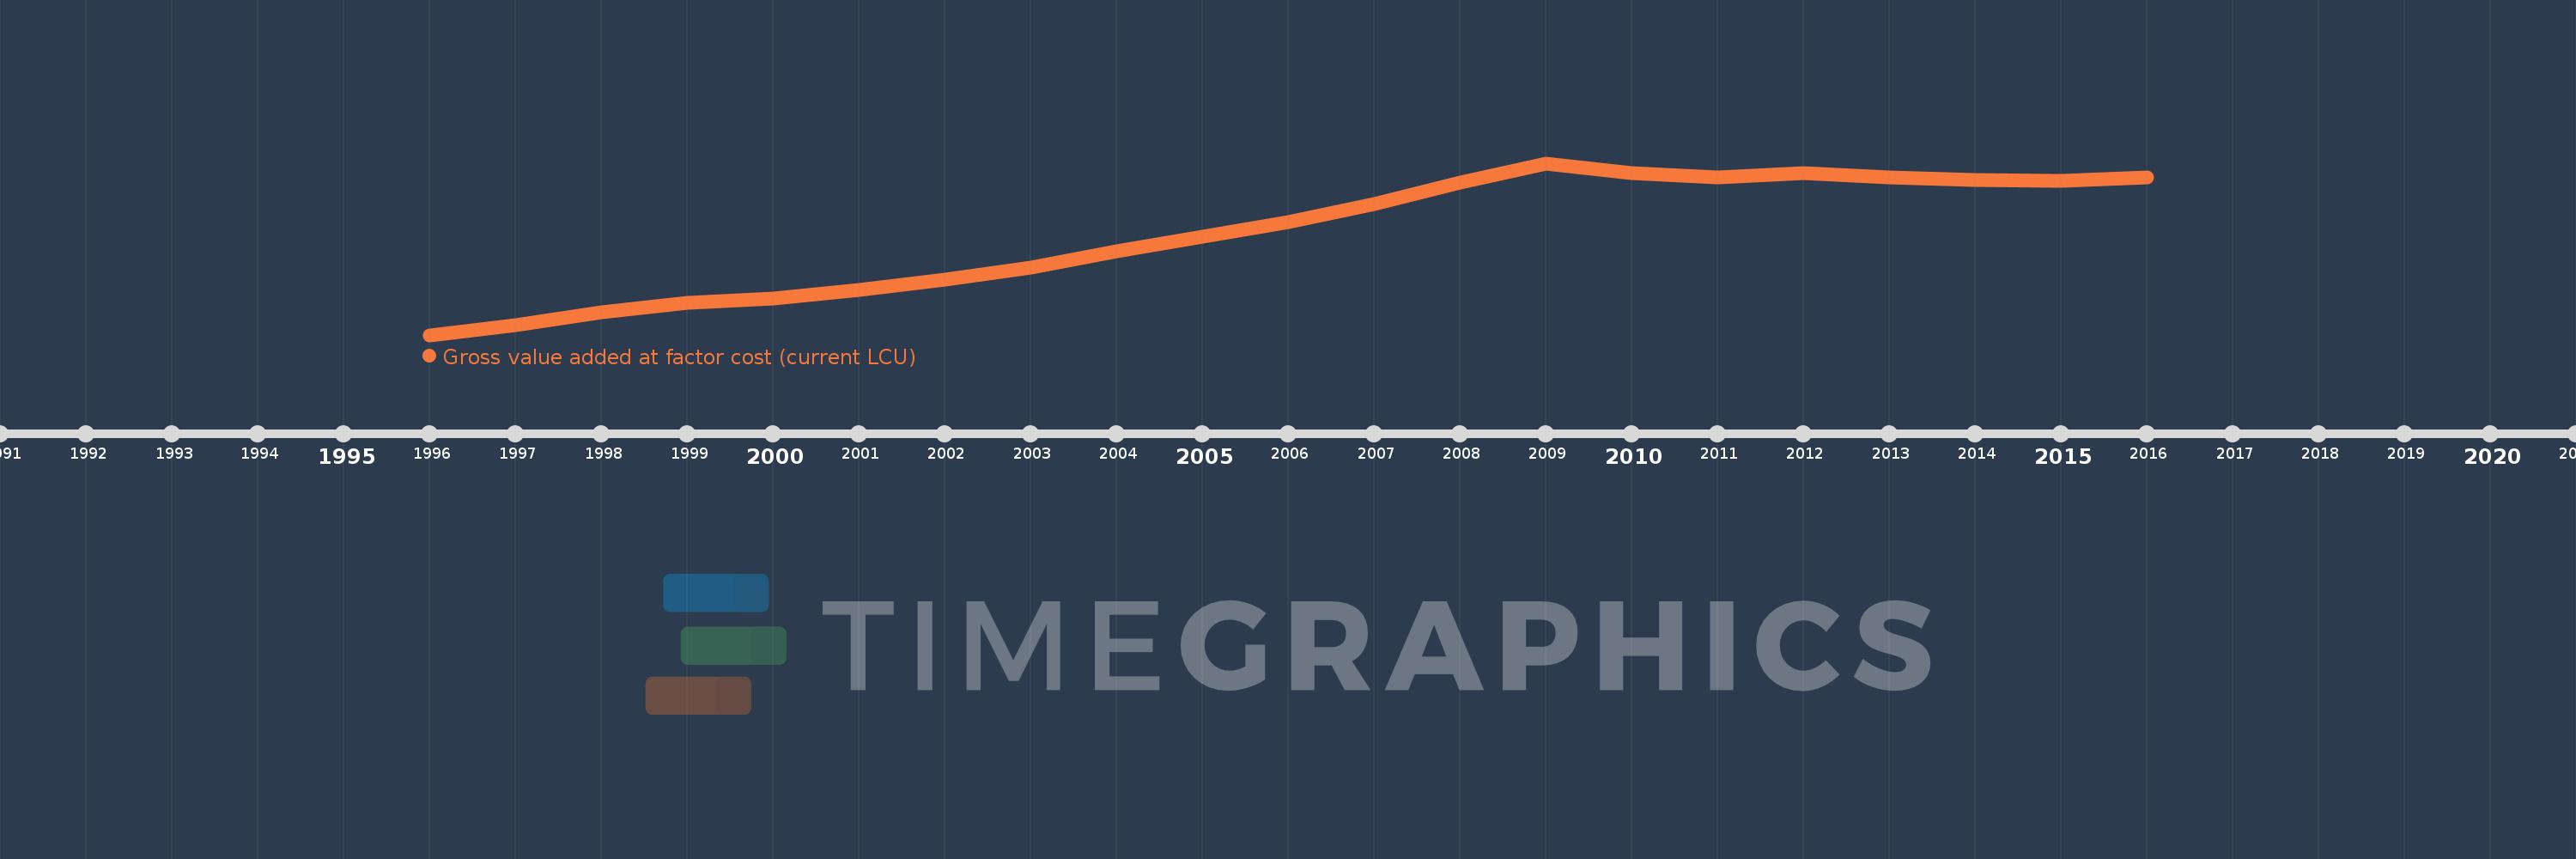
Gross value added at factor cost (current LCU)
2016,2015,2014,2013,2012,2011,2010,2009,2008,2007,2006,2005,2004,2003,2002,2001,2000,1999,1998,1997,1996
Estas estadísticas en otros países:
AfghanistanAlbaniaAlgeriaAndorraAntigua and BarbudaArgentinaArmeniaArubaAustraliaAustriaAzerbaijanBahamas, TheBahrainBangladeshBarbadosBelarusBelgiumBelizeBeninBermudaBhutanBoliviaBosnia and HerzegovinaBotswanaBrazilBulgariaBurkina FasoBurundiCabo VerdeCambodiaCameroonCanadaCayman IslandsCentral African RepublicChadChileColombiaCongo, Dem. Rep.Costa RicaCroatiaCubaCyprusCzech RepublicDenmarkDjiboutiDominicaDominican RepublicEcuadorEgypt, Arab Rep.El SalvadorEquatorial GuineaEritreaEstoniaEthiopiaFaroe IslandsFijiFinlandFranceGabonGambia, TheGeorgiaGermanyGhanaGreeceGrenadaGuatemalaGuineaGuinea-BissauGuyanaHondurasHong Kong SAR, ChinaHungaryIcelandIndiaIndonesiaIran, Islamic Rep.IrelandItalyJamaicaJapanJordanKazakhstanKenyaKiribatiKorea, Rep.KosovoKuwaitKyrgyz RepublicLao PDRLatviaLebanonLesothoLiberiaLibyaLiechtensteinLithuaniaLuxembourgMacao SAR, ChinaMacedonia, FYRMadagascarMalawiMalaysiaMaldivesMaliMaltaMarshall IslandsMauritaniaMauritiusMexicoMicronesia, Fed. Sts.MoldovaMongoliaMontenegroMoroccoMozambiqueNamibiaNepalNetherlandsNew ZealandNicaraguaNigeriaNorwayOmanPakistanPalauPanamaPapua New GuineaParaguayPeruPolandPortugalRomaniaRussian FederationRwandaSao Tome and PrincipeSenegalSerbiaSeychellesSierra LeoneSingaporeSlovak RepublicSloveniaSolomon IslandsSomaliaSouth AfricaSpainSri LankaSt. Kitts and NevisSt. LuciaSt. Vincent and the GrenadinesSudanSurinameSwazilandSwedenSwitzerlandSyrian Arab RepublicTajikistanTanzaniaThailandTimor-LesteTongaTrinidad and TobagoTunisiaTurkeyTurkmenistanTuvaluUgandaUkraineUnited KingdomUnited StatesUruguayUzbekistanVanuatuVenezuela, RBVietnamWest Bank and GazaYemen, Rep.ZambiaZimbabwe línea de tiempo (timeline):
En esta escala de tiempo se presenta un gráfico de 1996 y 2016 de Croatia. Los datos de 1995 están ausentes. El número de observaciones reales por fecha: 21.
Fuente (nombre):
Indicadores del desarrollo mundial
Fuente (organización):
World Bank national accounts data, and OECD National Accounts data files.
Categorías:
Economy & Growth
Se ha actualizado:
23 abr 2017 año
Los indicadores de los cambios de valor en los últimos años
Mínimo:
97.605 bn
1 ene 1996 año
Máximo:
296.865 bn
1 ene 2009 año
A la fecha de observación
Valor
Cambio absoluto
El cambio con respecto al valor anterior
1 ene 1996 año
97.605 bn
+97.605 bn
0.0%
1 ene 1997 año
108.777 bn
+11.172 bn
11.45%
1 ene 1998 año
123.867 bn
+15.089 bn
13.87%
1 ene 1999 año
135.29 bn
+11.423 bn
9.22%
1 ene 2000 año
139.75 bn
+4.461 bn
3.3%
1 ene 2001 año
150.071 bn
+10.321 bn
7.39%
1 ene 2002 año
161.662 bn
+11.591 bn
7.72%
1 ene 2003 año
176.166 bn
+14.504 bn
8.97%
1 ene 2004 año
194.491 bn
+18.325 bn
10.4%
1 ene 2005 año
212.0 bn
+17.509 bn
9.0%
1 ene 2006 año
228.657 bn
+16.657 bn
7.86%
1 ene 2007 año
249.199 bn
+20.542 bn
8.98%
1 ene 2008 año
274.226 bn
+25.027 bn
10.04%
1 ene 2009 año
296.865 bn
+22.639 bn
8.26%
1 ene 2010 año
285.646 bn
-11.219 bn
-3.78%
1 ene 2011 año
280.465 bn
-5.182 bn
-1.81%
1 ene 2012 año
285.707 bn
+5.242 bn
1.87%
1 ene 2013 año
280.305 bn
-5.403 bn
-1.89%
1 ene 2014 año
277.805 bn
-2.499 bn
-0.89%
1 ene 2015 año
276.777 bn
-1.029 bn
-0.37%
1 ene 2016 año
279.982 bn
+3.205 bn
1.16%
Ranking de los países por los datos estadísticos actuales


Comentarios: