29
/es/
es
AIzaSyAYiBZKx7MnpbEhh9jyipgxe19OcubqV5w
April 1, 2024
228563
Romania
ROU
true
2
1
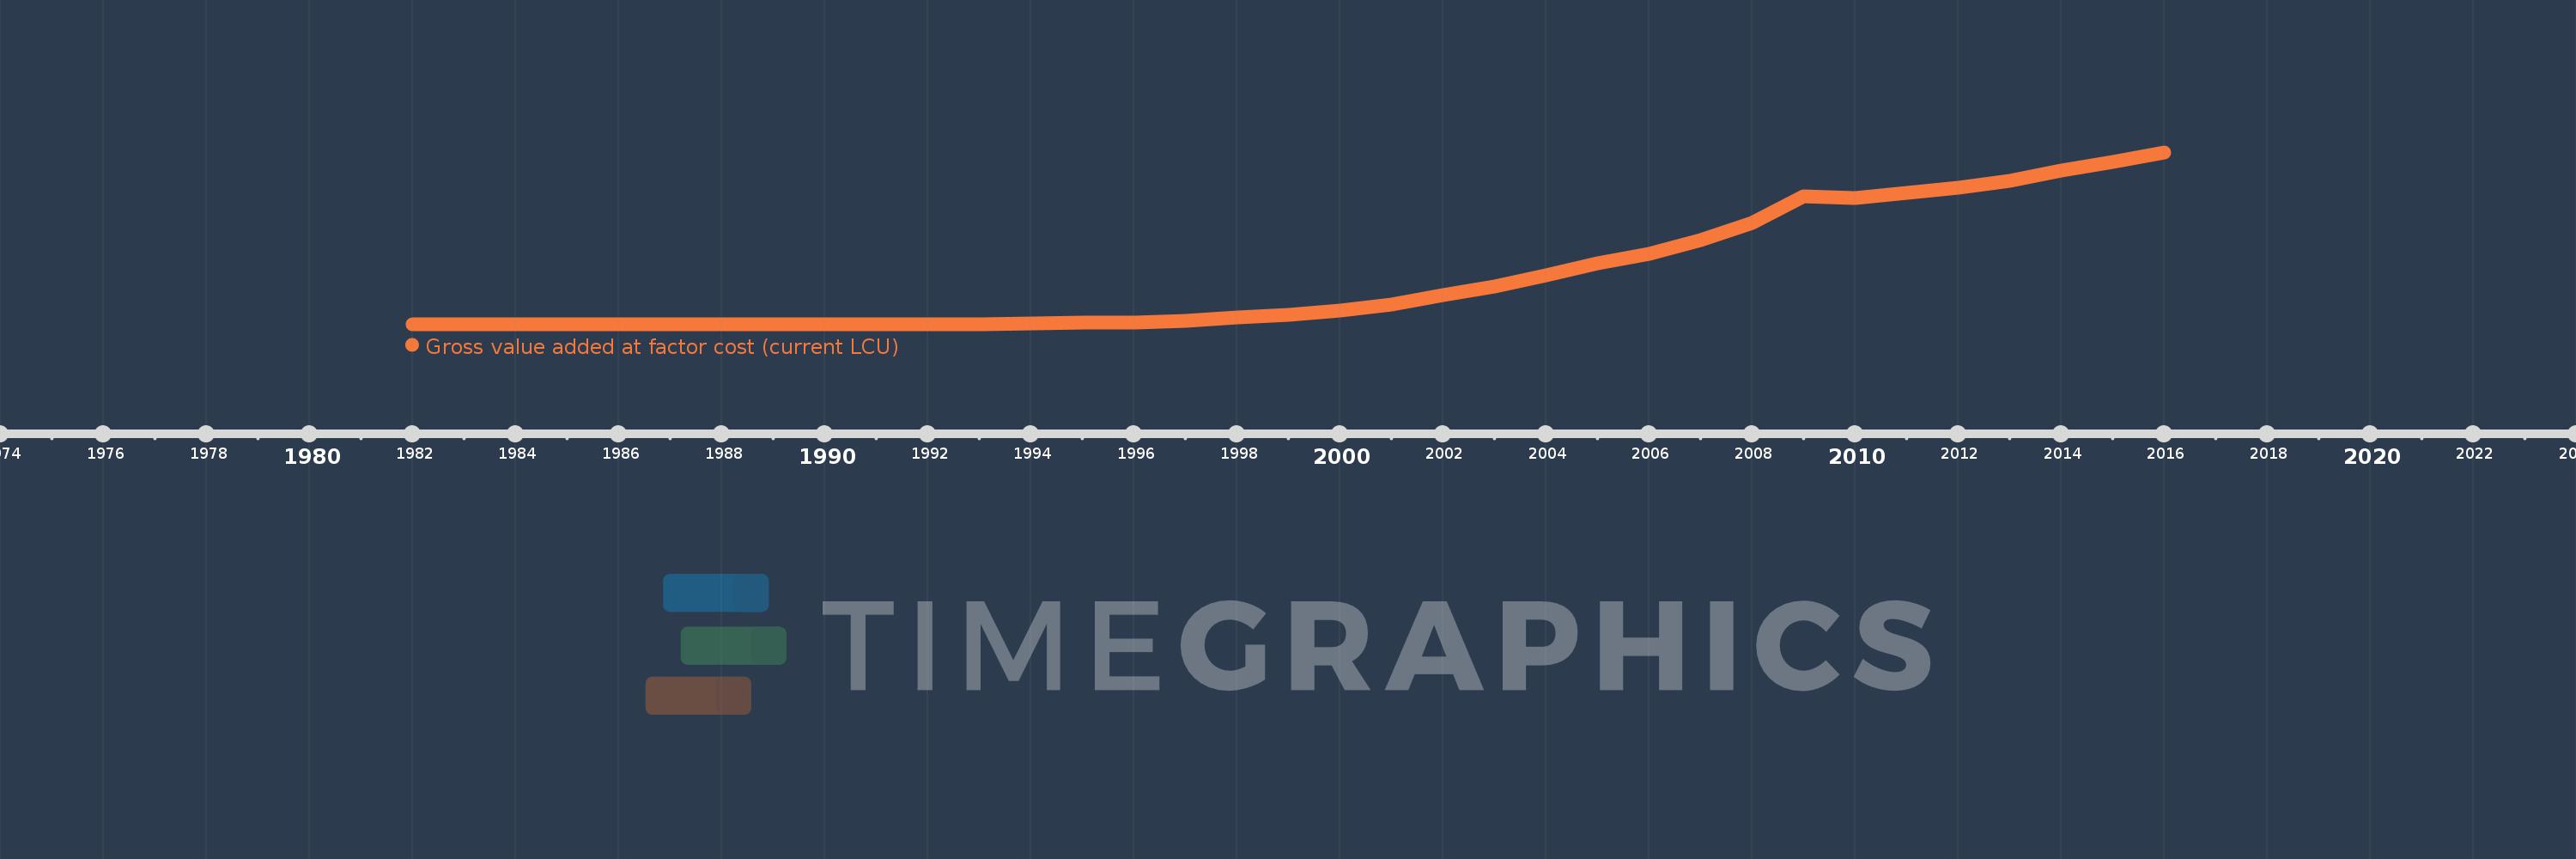
Gross value added at factor cost (current LCU)
2016,2015,2014,2013,2012,2011,2010,2009,2008,2007,2006,2005,2004,2003,2002,2001,2000,1999,1998,1997,1996,1995,1994,1993,1992,1991,1983,1982
Estas estadísticas en otros países:
AfghanistanAlbaniaAlgeriaAndorraAntigua and BarbudaArgentinaArmeniaArubaAustraliaAustriaAzerbaijanBahamas, TheBahrainBangladeshBarbadosBelarusBelgiumBelizeBeninBermudaBhutanBoliviaBosnia and HerzegovinaBotswanaBrazilBulgariaBurkina FasoBurundiCabo VerdeCambodiaCameroonCanadaCayman IslandsCentral African RepublicChadChileColombiaCongo, Dem. Rep.Costa RicaCroatiaCubaCyprusCzech RepublicDenmarkDjiboutiDominicaDominican RepublicEcuadorEgypt, Arab Rep.El SalvadorEquatorial GuineaEritreaEstoniaEthiopiaFaroe IslandsFijiFinlandFranceGabonGambia, TheGeorgiaGermanyGhanaGreeceGrenadaGuatemalaGuineaGuinea-BissauGuyanaHondurasHong Kong SAR, ChinaHungaryIcelandIndiaIndonesiaIran, Islamic Rep.IrelandItalyJamaicaJapanJordanKazakhstanKenyaKiribatiKorea, Rep.KosovoKuwaitKyrgyz RepublicLao PDRLatviaLebanonLesothoLiberiaLibyaLiechtensteinLithuaniaLuxembourgMacao SAR, ChinaMacedonia, FYRMadagascarMalawiMalaysiaMaldivesMaliMaltaMarshall IslandsMauritaniaMauritiusMexicoMicronesia, Fed. Sts.MoldovaMongoliaMontenegroMoroccoMozambiqueNamibiaNepalNetherlandsNew ZealandNicaraguaNigeriaNorwayOmanPakistanPalauPanamaPapua New GuineaParaguayPeruPolandPortugalRomaniaRussian FederationRwandaSao Tome and PrincipeSenegalSerbiaSeychellesSierra LeoneSingaporeSlovak RepublicSloveniaSolomon IslandsSomaliaSouth AfricaSpainSri LankaSt. Kitts and NevisSt. LuciaSt. Vincent and the GrenadinesSudanSurinameSwazilandSwedenSwitzerlandSyrian Arab RepublicTajikistanTanzaniaThailandTimor-LesteTongaTrinidad and TobagoTunisiaTurkeyTurkmenistanTuvaluUgandaUkraineUnited KingdomUnited StatesUruguayUzbekistanVanuatuVenezuela, RBVietnamWest Bank and GazaYemen, Rep.ZambiaZimbabwe línea de tiempo (timeline):
En esta escala de tiempo se presenta un gráfico de 1982 y 2016 de Romania. Los datos de 1981 están ausentes. El número de observaciones reales por fecha: 28.
Fuente (nombre):
Indicadores del desarrollo mundial
Fuente (organización):
World Bank national accounts data, and OECD National Accounts data files.
Categorías:
Economy & Growth
Se ha actualizado:
23 abr 2017 año
Los indicadores de los cambios de valor en los últimos años
Mínimo:
58.56 millones
1 ene 1982 año
Máximo:
625.879 bn
1 ene 2016 año
A la fecha de observación
Valor
Cambio absoluto
El cambio con respecto al valor anterior
1 ene 1982 año
58.56 millones
+58.56 millones
0.0%
1 ene 1983 año
66.24 millones
+7.68 millones
13.11%
1 ene 1991 año
78.81 millones
+12.57 millones
18.98%
1 ene 1992 año
206.62 millones
+127.81 millones
162.17%
1 ene 1993 año
591.52 millones
+384.9 millones
186.28%
1 ene 1994 año
1.858 bn
+1.266 bn
214.09%
1 ene 1995 año
4.595 bn
+2.738 bn
147.34%
1 ene 1996 año
7.217 bn
+2.622 bn
57.05%
1 ene 1997 año
10.838 bn
+3.621 bn
50.17%
1 ene 1998 año
23.851 bn
+13.012 bn
120.06%
1 ene 1999 año
33.374 bn
+9.524 bn
39.93%
1 ene 2000 año
49.432 bn
+16.058 bn
48.11%
1 ene 2001 año
73.027 bn
+23.595 bn
47.73%
1 ene 2002 año
106.501 bn
+33.474 bn
45.84%
1 ene 2003 año
137.535 bn
+31.034 bn
29.14%
1 ene 2004 año
176.974 bn
+39.439 bn
28.68%
1 ene 2005 año
222.311 bn
+45.337 bn
25.62%
1 ene 2006 año
256.767 bn
+34.456 bn
15.5%
1 ene 2007 año
306.623 bn
+49.857 bn
19.42%
1 ene 2008 año
369.789 bn
+63.166 bn
20.6%
1 ene 2009 año
467.122 bn
+97.333 bn
26.32%
1 ene 2010 año
459.926 bn
-7.196 bn
-1.54%
1 ene 2011 año
477.029 bn
+17.102 bn
3.72%
1 ene 2012 año
495.832 bn
+18.804 bn
3.94%
1 ene 2013 año
522.296 bn
+26.464 bn
5.34%
1 ene 2014 año
561.404 bn
+39.108 bn
7.49%
1 ene 2015 año
591.207 bn
+29.803 bn
5.31%
1 ene 2016 año
625.879 bn
+34.673 bn
5.86%
Ranking de los países por los datos estadísticos actuales


Comentarios: