29
/es/
es
AIzaSyAYiBZKx7MnpbEhh9jyipgxe19OcubqV5w
April 1, 2024
207680
Netherlands
NLD
true
2
1
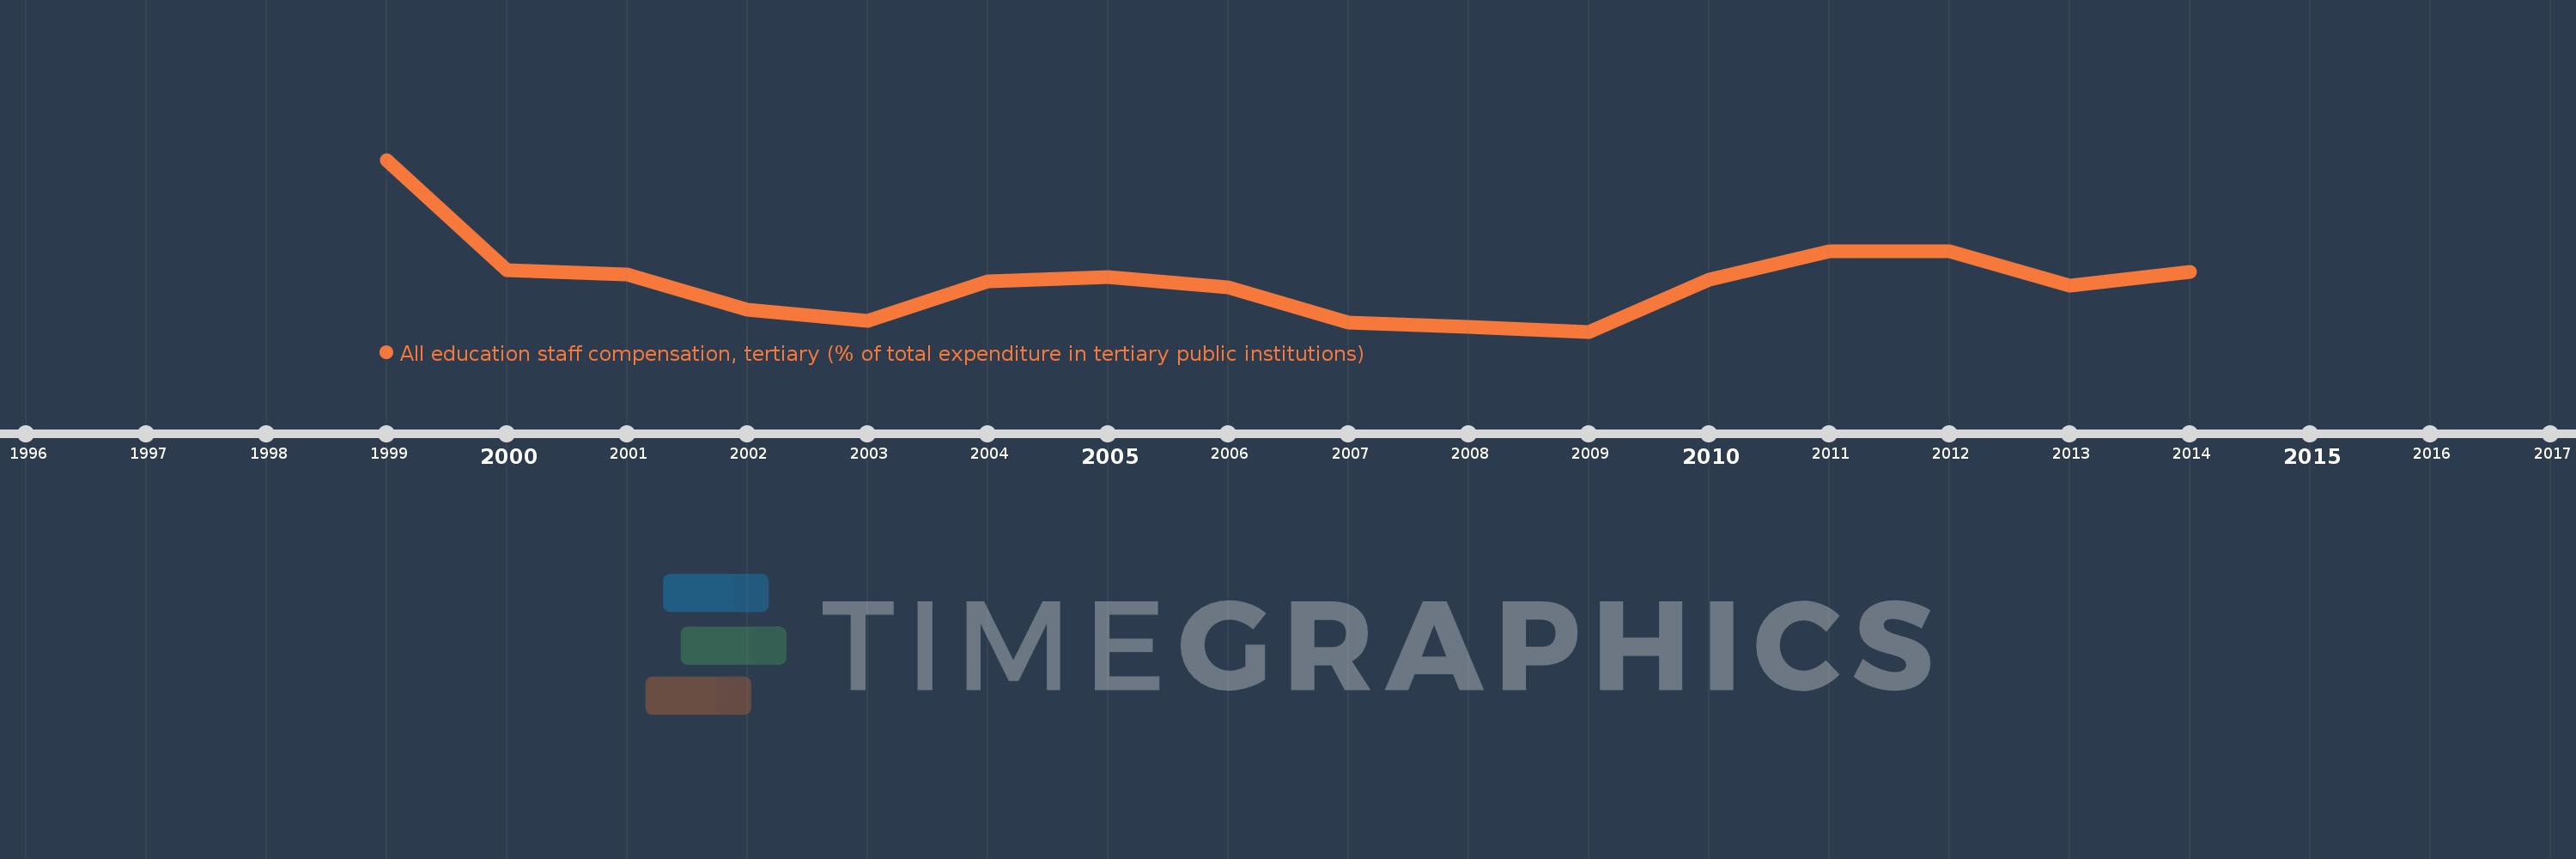
All education staff compensation, tertiary (% of total expenditure in tertiary public institutions)
2014,2013,2012,2011,2010,2009,2008,2007,2006,2005,2004,2003,2002,2001,2000,1999
Estas estadísticas en otros países:
línea de tiempo (timeline):
En esta escala de tiempo se presenta un gráfico de 1999 y 2014 de Netherlands. Los datos de 1998 están ausentes. El número de observaciones reales por fecha: 16.
Fuente (nombre):
Indicadores del desarrollo mundial
Fuente (organización):
United Nations Educational, Scientific, and Cultural Organization (UNESCO) Institute for Statistics.
Categorías:
Education
Se ha actualizado:
23 abr 2017 año
Los indicadores de los cambios de valor en los últimos años
Mínimo:
58.877
1 ene 2009 año
Máximo:
69.547
1 ene 1999 año
A la fecha de observación
Valor
Cambio absoluto
El cambio con respecto al valor anterior
1 ene 1999 año
69.547
+69.547
0.0%
1 ene 2000 año
62.677
-6.87
-9.88%
1 ene 2001 año
62.413
-0.264
-0.42%
1 ene 2002 año
60.221
-2.192
-3.51%
1 ene 2003 año
59.522
-0.7
-1.16%
1 ene 2004 año
61.98
+2.458
4.13%
1 ene 2005 año
62.259
+0.279
0.45%
1 ene 2006 año
61.603
-0.656
-1.05%
1 ene 2007 año
59.42
-2.182
-3.54%
1 ene 2008 año
59.165
-0.255
-0.43%
1 ene 2009 año
58.877
-0.288
-0.49%
1 ene 2010 año
62.116
+3.239
5.5%
1 ene 2011 año
63.889
+1.773
2.85%
1 ene 2012 año
63.871
-0.018
-0.03%
1 ene 2013 año
61.744
-2.127
-3.33%
1 ene 2014 año
62.595
+0.851
1.38%
Ranking de los países por los datos estadísticos actuales


Comentarios: