29
/es/
es
AIzaSyAYiBZKx7MnpbEhh9jyipgxe19OcubqV5w
April 1, 2024
54569
Post-demographic dividend
PST
false
2
1
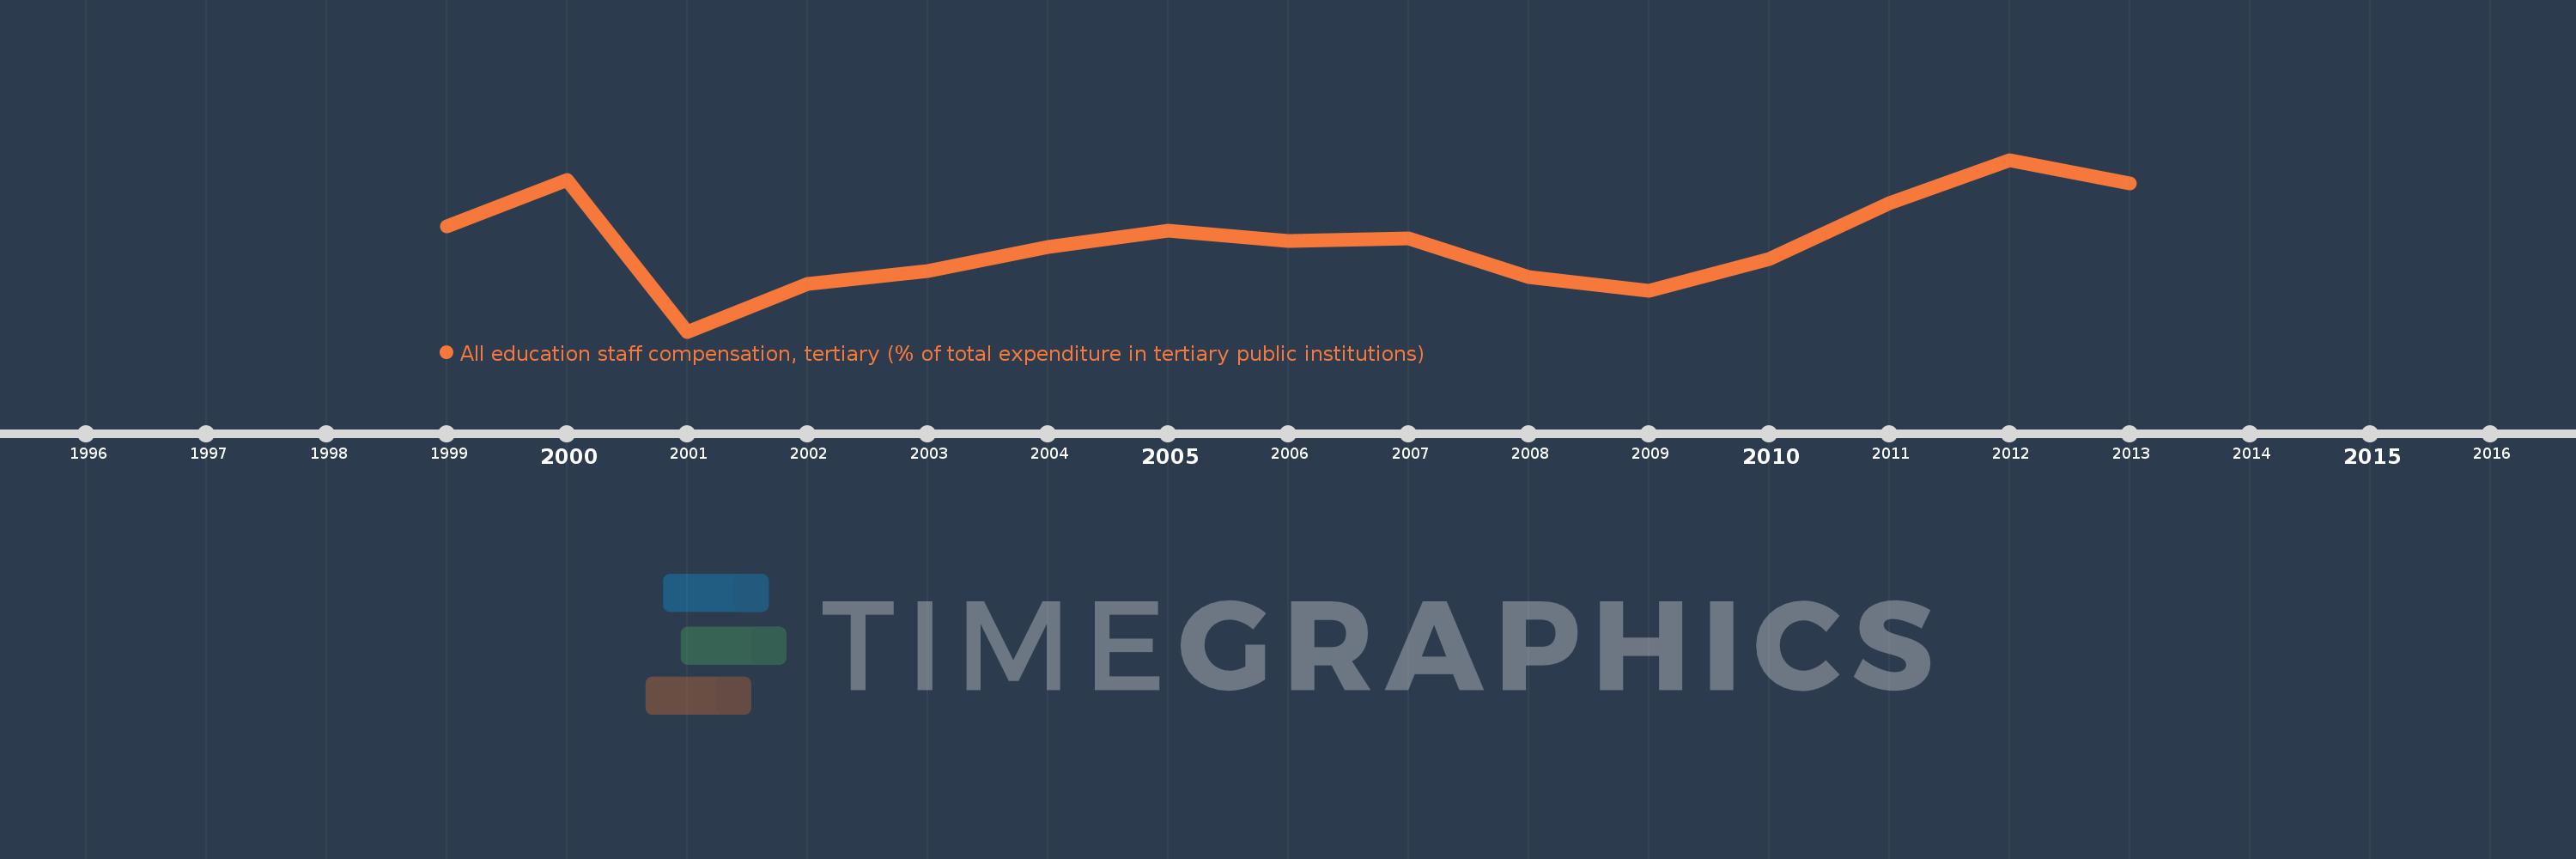
All education staff compensation, tertiary (% of total expenditure in tertiary public institutions)
2013,2012,2011,2010,2009,2008,2007,2006,2005,2004,2003,2002,2001,2000,1999
Estas estadísticas en otros países:
línea de tiempo (timeline):
En esta escala de tiempo se presenta un gráfico de 1999 y 2013 de Post-demographic dividend. Los datos de 1998 están ausentes. El número de observaciones reales por fecha: 15.
Fuente (nombre):
Indicadores del desarrollo mundial
Fuente (organización):
United Nations Educational, Scientific, and Cultural Organization (UNESCO) Institute for Statistics.
Categorías:
Education
Se ha actualizado:
23 abr 2017 año
Los indicadores de los cambios de valor en los últimos años
Mínimo:
57.965
1 ene 2001 año
Máximo:
62.359
1 ene 2012 año
A la fecha de observación
Valor
Cambio absoluto
El cambio con respecto al valor anterior
1 ene 1999 año
60.663
+60.663
0.0%
1 ene 2000 año
61.842
+1.178
1.94%
1 ene 2001 año
57.965
-3.877
-6.27%
1 ene 2002 año
59.174
+1.21
2.09%
1 ene 2003 año
59.522
+0.347
0.59%
1 ene 2004 año
60.127
+0.606
1.02%
1 ene 2005 año
60.541
+0.414
0.69%
1 ene 2006 año
60.272
-0.269
-0.44%
1 ene 2007 año
60.351
+0.078
0.13%
1 ene 2008 año
59.363
-0.987
-1.64%
1 ene 2009 año
59.017
-0.347
-0.58%
1 ene 2010 año
59.827
+0.811
1.37%
1 ene 2011 año
61.253
+1.426
2.38%
1 ene 2012 año
62.359
+1.106
1.81%
1 ene 2013 año
61.744
-0.615
-0.99%
Ranking de los países por los datos estadísticos actuales


Comentarios: