29
/es/
es
AIzaSyAYiBZKx7MnpbEhh9jyipgxe19OcubqV5w
April 1, 2024
30467
Europe & Central Asia
ECS
false
2
1
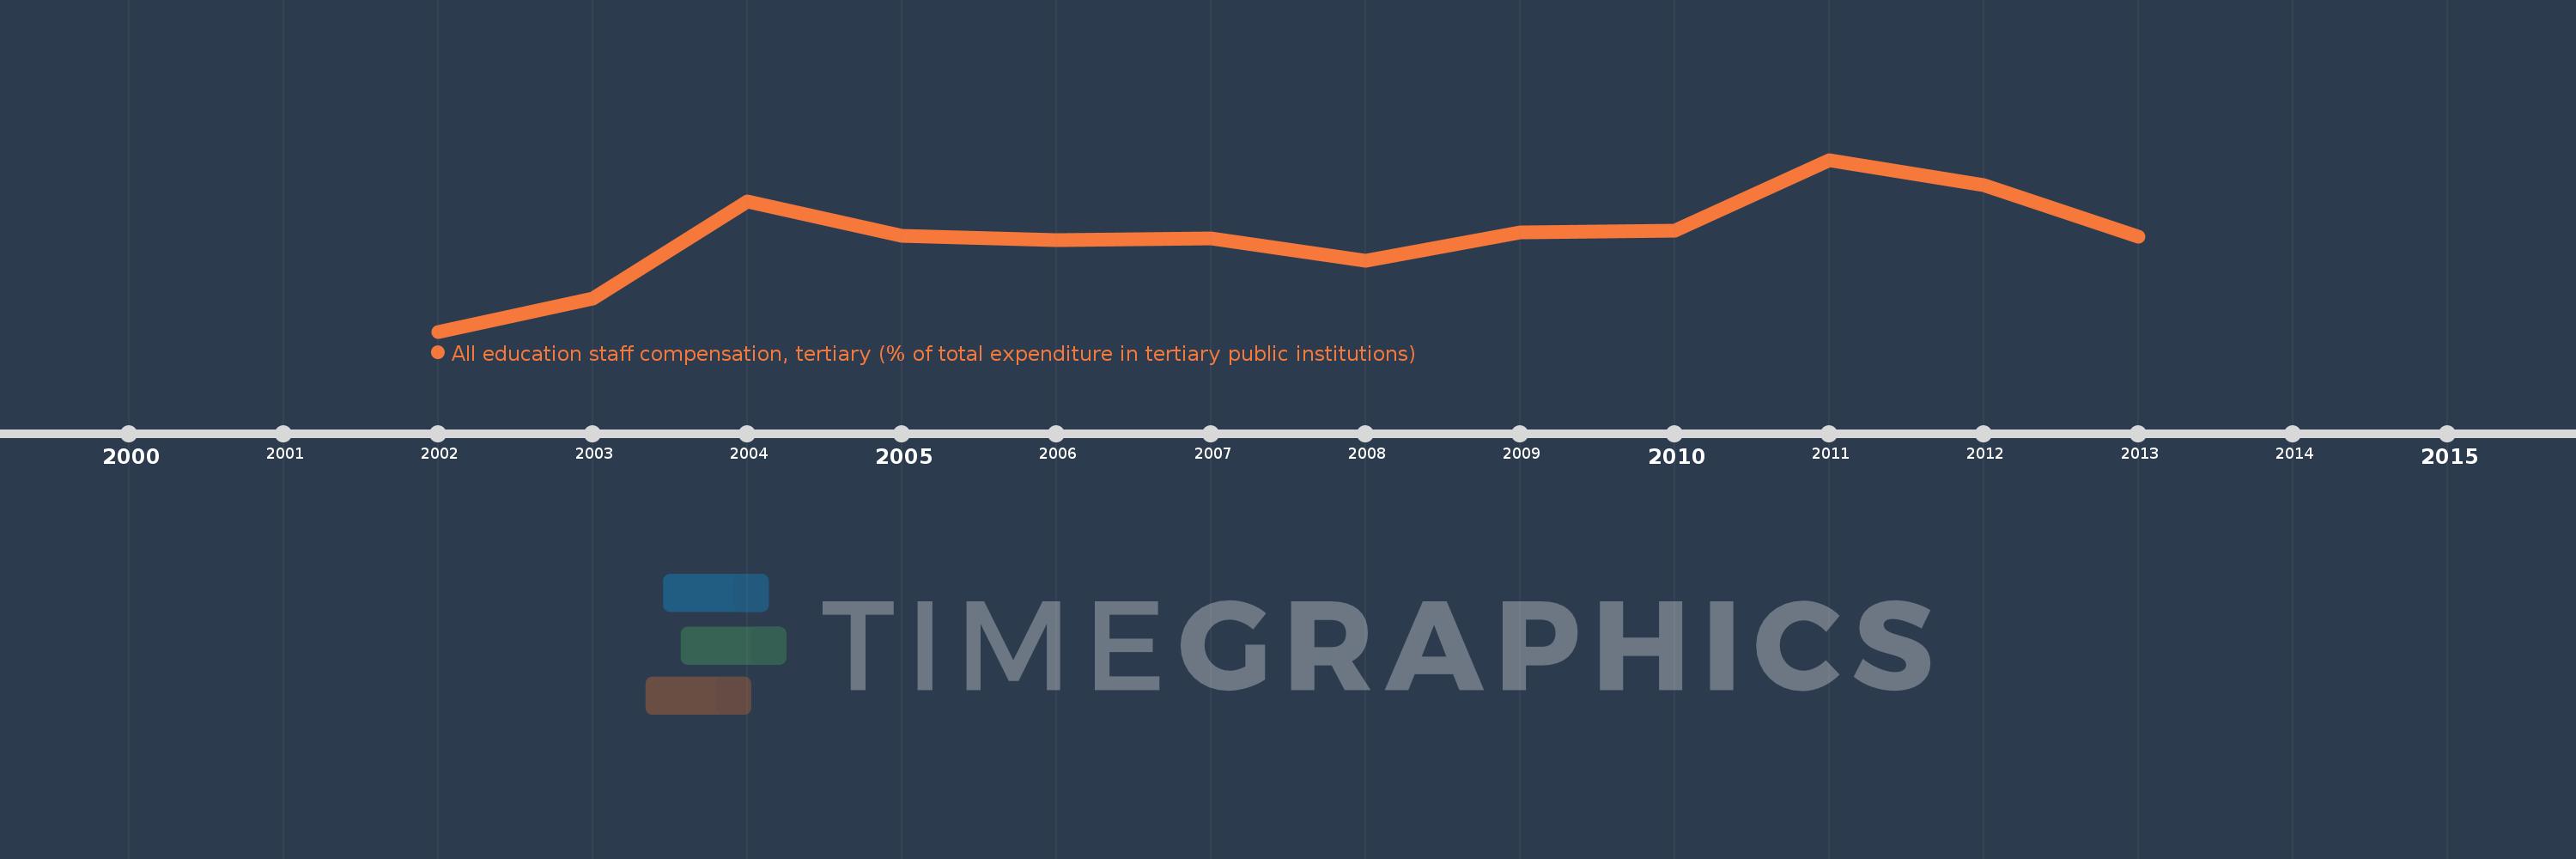
All education staff compensation, tertiary (% of total expenditure in tertiary public institutions)
2013,2012,2011,2010,2009,2008,2007,2006,2005,2004,2003,2002
Estas estadísticas en otros países:
línea de tiempo (timeline):
En esta escala de tiempo se presenta un gráfico de 2002 y 2013 de Europe & Central Asia. Los datos de 2001 están ausentes. El número de observaciones reales por fecha: 12.
Fuente (nombre):
Indicadores del desarrollo mundial
Fuente (organización):
United Nations Educational, Scientific, and Cultural Organization (UNESCO) Institute for Statistics.
Categorías:
Education
Se ha actualizado:
23 abr 2017 año
Los indicadores de los cambios de valor en los últimos años
Mínimo:
58.127
1 ene 2002 año
Máximo:
62.627
1 ene 2011 año
A la fecha de observación
Valor
Cambio absoluto
El cambio con respecto al valor anterior
1 ene 2002 año
58.127
+58.127
0.0%
1 ene 2003 año
58.983
+0.856
1.47%
1 ene 2004 año
61.545
+2.562
4.34%
1 ene 2005 año
60.645
-0.9
-1.46%
1 ene 2006 año
60.518
-0.127
-0.21%
1 ene 2007 año
60.576
+0.058
0.1%
1 ene 2008 año
59.985
-0.592
-0.98%
1 ene 2009 año
60.733
+0.748
1.25%
1 ene 2010 año
60.778
+0.045
0.07%
1 ene 2011 año
62.627
+1.848
3.04%
1 ene 2012 año
61.974
-0.653
-1.04%
1 ene 2013 año
60.611
-1.363
-2.2%
Ranking de los países por los datos estadísticos actuales


Comentarios: