29
/it/
it
AIzaSyAYiBZKx7MnpbEhh9jyipgxe19OcubqV5w
April 1, 2024
207680
Netherlands
NLD
true
2
1
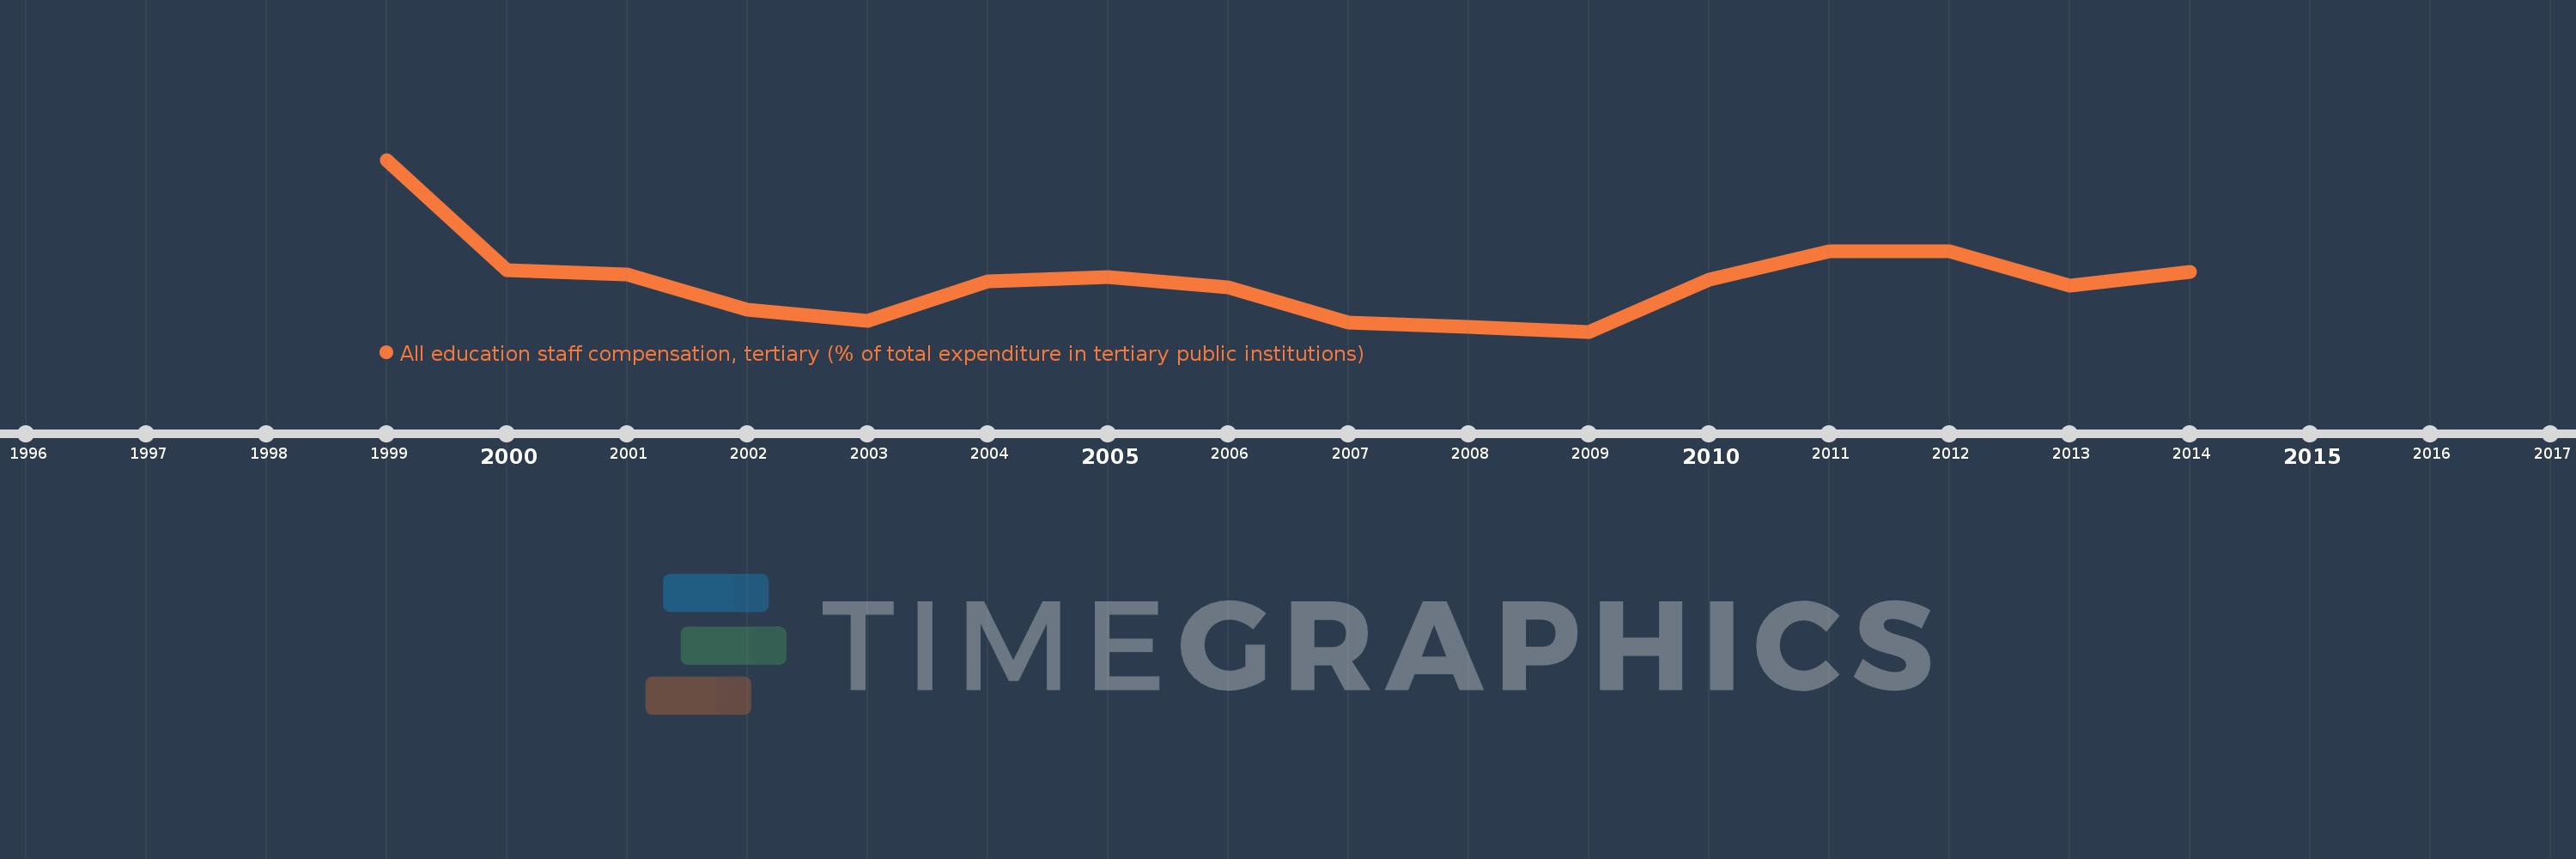
All education staff compensation, tertiary (% of total expenditure in tertiary public institutions)
2014,2013,2012,2011,2010,2009,2008,2007,2006,2005,2004,2003,2002,2001,2000,1999
Queste statistiche in altri paesi:
Linea del tempo:
Questa scala temporale mostra un grafico dal 1999 anno al 2014 anno. Netherlands. I dati fino ad 1998 anno non disponibili. Il numero di osservazioni attuali secondo i date: 16.
La fonte (nome):
Indicatori dello sviluppo mondiale
La fonte (organizzazione):
United Nations Educational, Scientific, and Cultural Organization (UNESCO) Institute for Statistics.
Categorie:
Education
sono stati aggiornati
23 apr 2017 anni
Indicatori delle variazioni dei valori per anni
Minima:
58.877
1 gen 2009 anni
Massimo:
69.547
1 gen 1999 anni
Alla data di osservazione
Valore
Variazione assoluta
La variazione rispetto al valore precedente
1 gen 1999 anni
69.547
+69.547
0.0%
1 gen 2000 anni
62.677
-6.87
-9.88%
1 gen 2001 anni
62.413
-0.264
-0.42%
1 gen 2002 anni
60.221
-2.192
-3.51%
1 gen 2003 anni
59.522
-0.7
-1.16%
1 gen 2004 anni
61.98
+2.458
4.13%
1 gen 2005 anni
62.259
+0.279
0.45%
1 gen 2006 anni
61.603
-0.656
-1.05%
1 gen 2007 anni
59.42
-2.182
-3.54%
1 gen 2008 anni
59.165
-0.255
-0.43%
1 gen 2009 anni
58.877
-0.288
-0.49%
1 gen 2010 anni
62.116
+3.239
5.5%
1 gen 2011 anni
63.889
+1.773
2.85%
1 gen 2012 anni
63.871
-0.018
-0.03%
1 gen 2013 anni
61.744
-2.127
-3.33%
1 gen 2014 anni
62.595
+0.851
1.38%
Classificazione dei paesi secondo i statistiche attuali per anni


Commenti: