29
/it/
it
AIzaSyAYiBZKx7MnpbEhh9jyipgxe19OcubqV5w
April 1, 2024
35539
High income
HIC
false
2
1
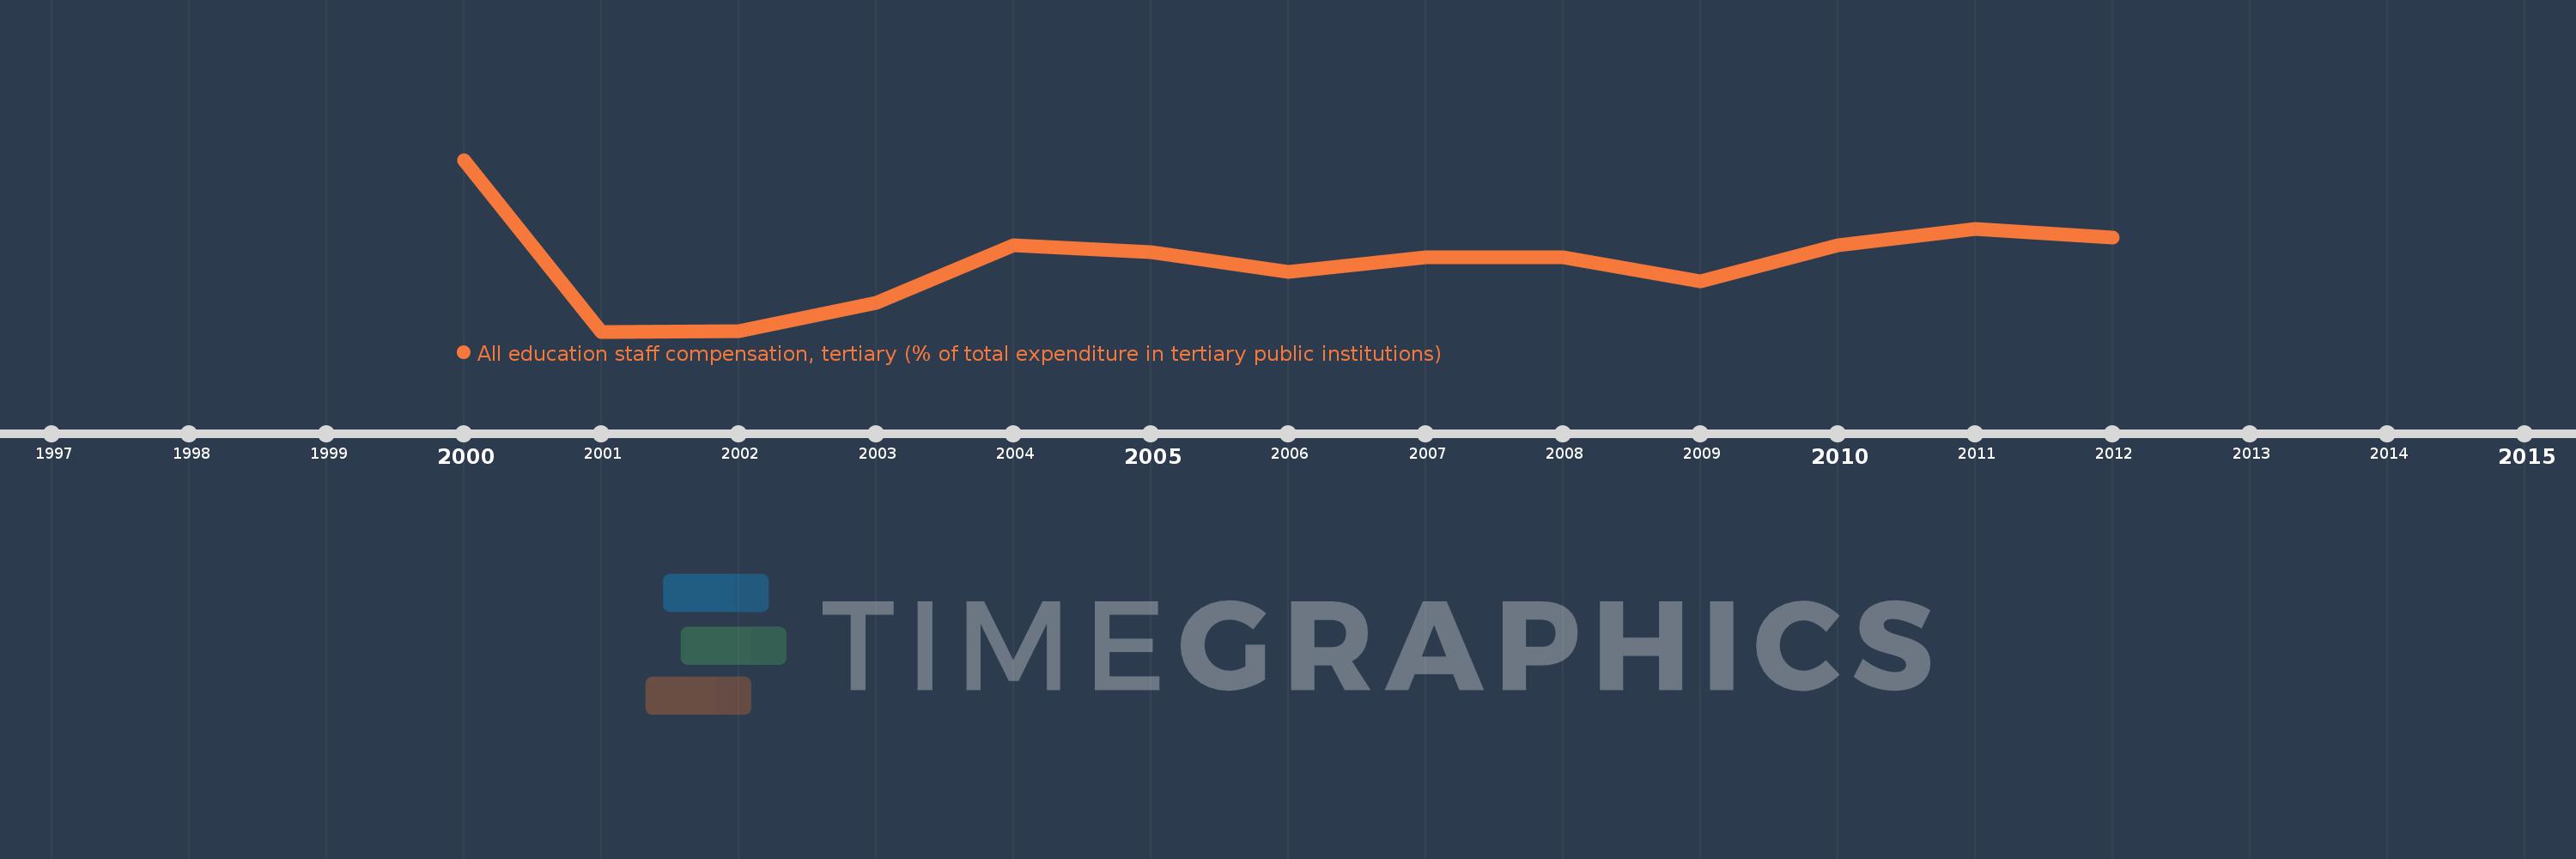
All education staff compensation, tertiary (% of total expenditure in tertiary public institutions)
2012,2011,2010,2009,2008,2007,2006,2005,2004,2003,2002,2001,2000
Queste statistiche in altri paesi:
Linea del tempo:
Questa scala temporale mostra un grafico dal 2000 anno al 2012 anno. High income. I dati fino ad 1999 anno non disponibili. Il numero di osservazioni attuali secondo i date: 13.
La fonte (nome):
Indicatori dello sviluppo mondiale
La fonte (organizzazione):
United Nations Educational, Scientific, and Cultural Organization (UNESCO) Institute for Statistics.
Categorie:
Education
sono stati aggiornati
23 apr 2017 anni
Indicatori delle variazioni dei valori per anni
Minima:
58.12
1 gen 2001 anni
Massimo:
63.348
1 gen 2000 anni
Alla data di osservazione
Valore
Variazione assoluta
La variazione rispetto al valore precedente
1 gen 2000 anni
63.348
+63.348
0.0%
1 gen 2001 anni
58.12
-5.227
-8.25%
1 gen 2002 anni
58.127
+0.007
0.01%
1 gen 2003 anni
58.983
+0.856
1.47%
1 gen 2004 anni
60.754
+1.771
3.0%
1 gen 2005 anni
60.541
-0.213
-0.35%
1 gen 2006 anni
59.929
-0.612
-1.01%
1 gen 2007 anni
60.386
+0.456
0.76%
1 gen 2008 anni
60.389
+0.003
0.01%
1 gen 2009 anni
59.637
-0.752
-1.24%
1 gen 2010 anni
60.747
+1.11
1.86%
1 gen 2011 anni
61.253
+0.506
0.83%
1 gen 2012 anni
60.971
-0.283
-0.46%
Classificazione dei paesi secondo i statistiche attuali per anni


Commenti: