29
/es/
es
AIzaSyAYiBZKx7MnpbEhh9jyipgxe19OcubqV5w
April 1, 2024
160526
Israel
ISR
true
2
1
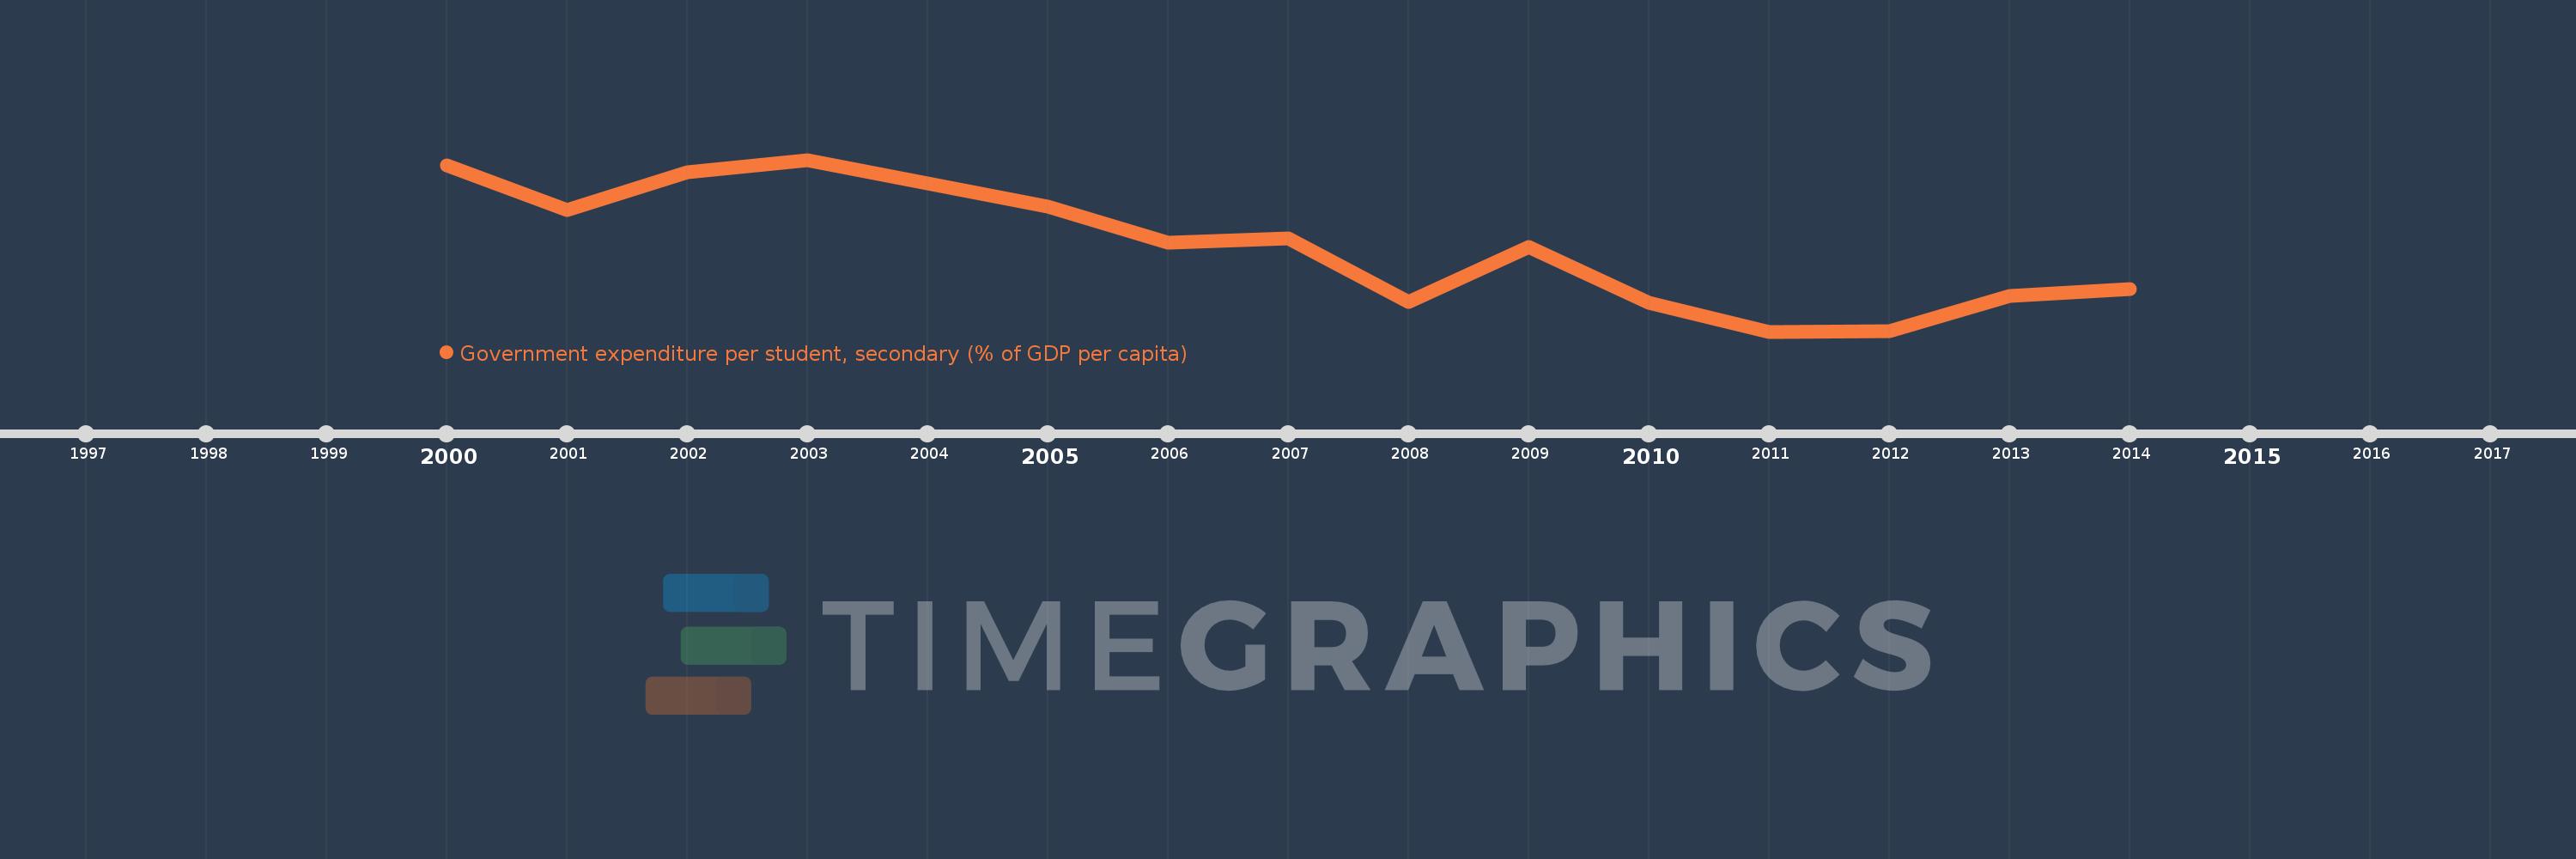
Government expenditure per student, secondary (% of GDP per capita)
2014,2013,2012,2011,2010,2009,2008,2007,2006,2005,2004,2003,2002,2001,2000
Estas estadísticas en otros países:
línea de tiempo (timeline):
En esta escala de tiempo se presenta un gráfico de 2000 y 2014 de Israel. Los datos de 1999 están ausentes. El número de observaciones reales por fecha: 15.
Fuente (nombre):
Indicadores del desarrollo mundial
Fuente (organización):
United Nations Educational, Scientific, and Cultural Organization (UNESCO) Institute for Statistics.
Categorías:
Education
Se ha actualizado:
23 abr 2017 año
Los indicadores de los cambios de valor en los últimos años
Mínimo:
15.262
1 ene 2011 año
Máximo:
18.83
1 ene 2003 año
A la fecha de observación
Valor
Cambio absoluto
El cambio con respecto al valor anterior
1 ene 2000 año
18.713
+18.713
0.0%
1 ene 2001 año
17.782
-0.931
-4.97%
1 ene 2002 año
18.563
+0.781
4.39%
1 ene 2003 año
18.83
+0.268
1.44%
1 ene 2004 año
18.333
-0.498
-2.64%
1 ene 2005 año
17.853
-0.479
-2.61%
1 ene 2006 año
17.11
-0.743
-4.16%
1 ene 2007 año
17.197
+0.087
0.51%
1 ene 2008 año
15.88
-1.317
-7.66%
1 ene 2009 año
17.024
+1.144
7.2%
1 ene 2010 año
15.867
-1.156
-6.79%
1 ene 2011 año
15.262
-0.605
-3.81%
1 ene 2012 año
15.266
+0.004
0.03%
1 ene 2013 año
15.998
+0.733
4.8%
1 ene 2014 año
16.153
+0.155
0.97%
Ranking de los países por los datos estadísticos actuales


Comentarios: