29
/es/
es
AIzaSyAYiBZKx7MnpbEhh9jyipgxe19OcubqV5w
April 1, 2024
255213
Swaziland
SWZ
true
2
1
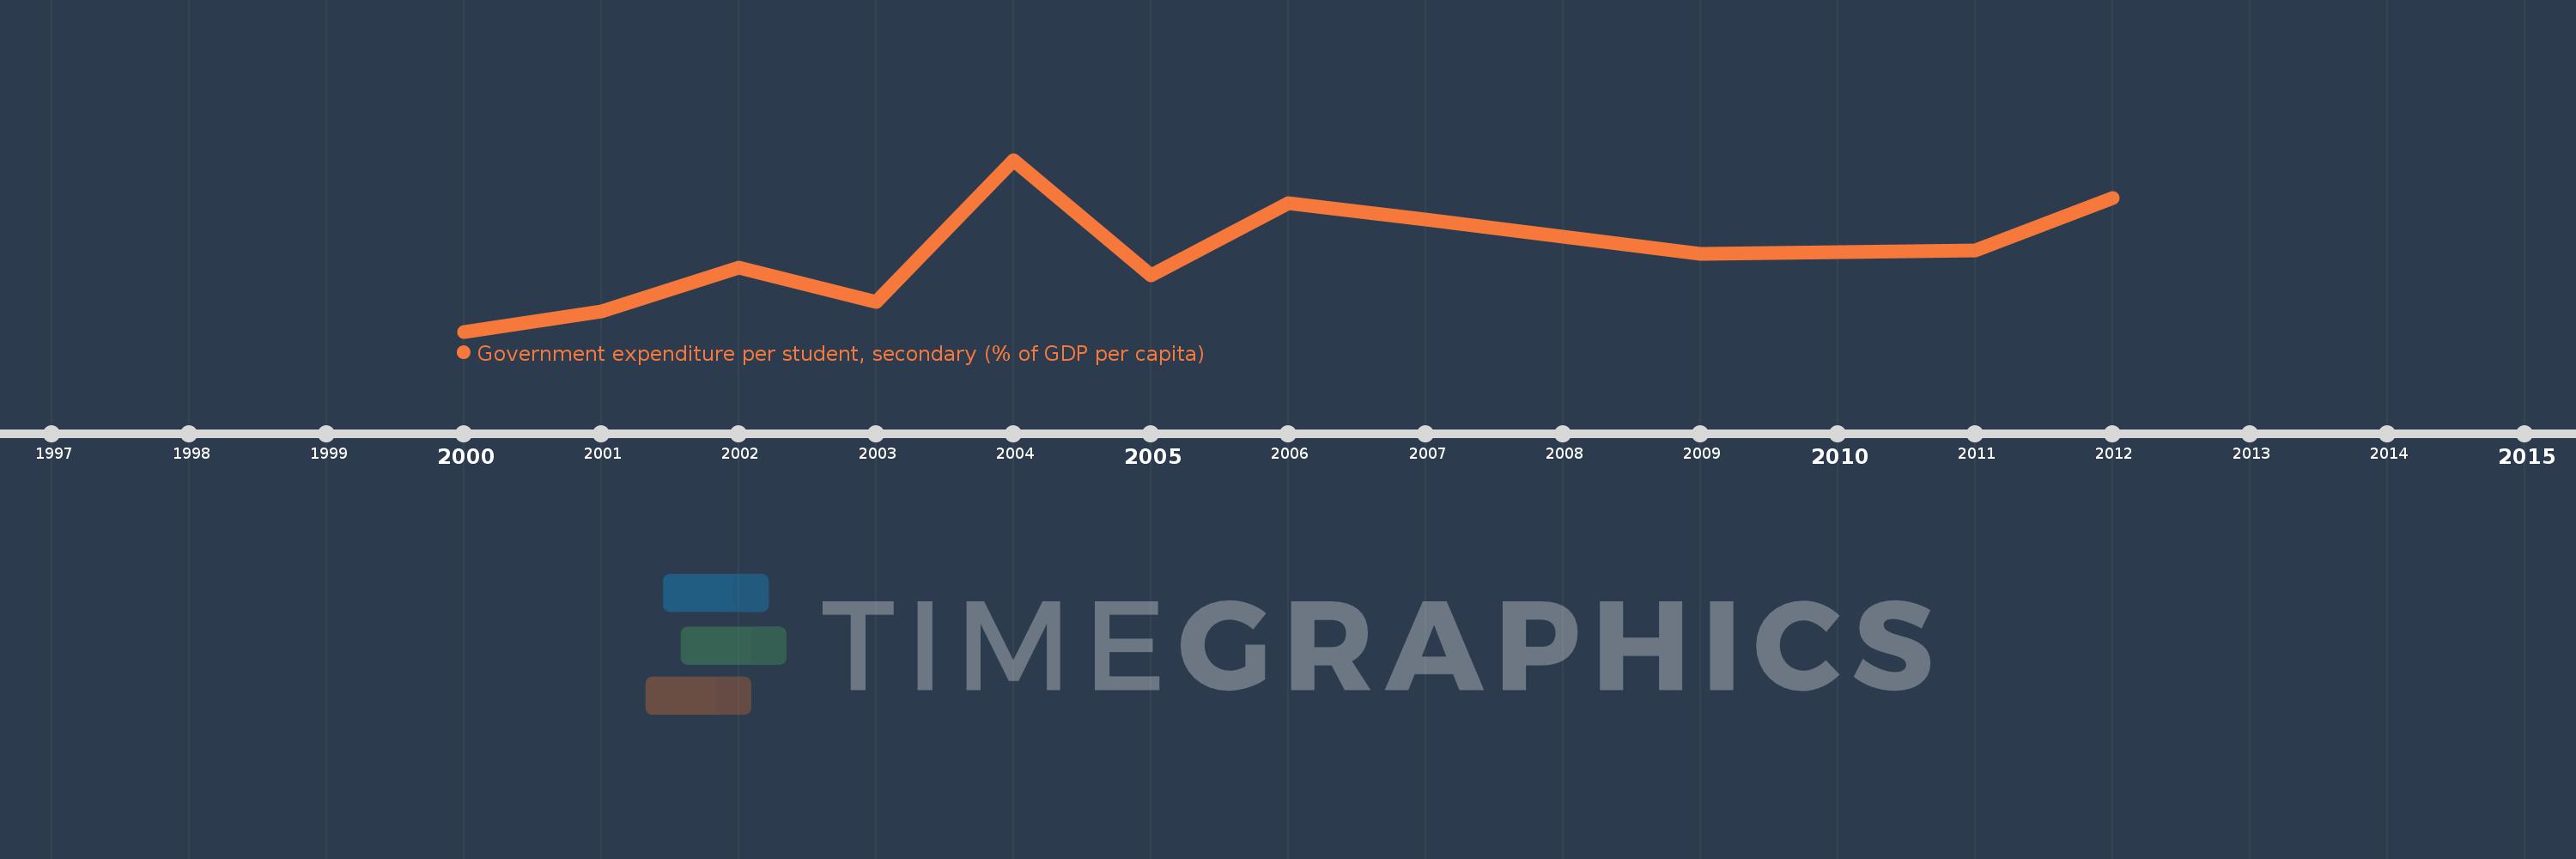
Government expenditure per student, secondary (% of GDP per capita)
2012,2011,2009,2007,2006,2005,2004,2003,2002,2001,2000
Estas estadísticas en otros países:
línea de tiempo (timeline):
En esta escala de tiempo se presenta un gráfico de 2000 y 2012 de Swaziland. Los datos de 1999 están ausentes. El número de observaciones reales por fecha: 11.
Fuente (nombre):
Indicadores del desarrollo mundial
Fuente (organización):
United Nations Educational, Scientific, and Cultural Organization (UNESCO) Institute for Statistics.
Categorías:
Education
Se ha actualizado:
23 abr 2017 año
Los indicadores de los cambios de valor en los últimos años
Mínimo:
23.163
1 ene 2000 año
Máximo:
48.295
1 ene 2004 año
A la fecha de observación
Valor
Cambio absoluto
El cambio con respecto al valor anterior
1 ene 2000 año
23.163
+23.163
0.0%
1 ene 2001 año
26.116
+2.953
12.75%
1 ene 2002 año
32.522
+6.406
24.53%
1 ene 2003 año
27.527
-4.995
-15.36%
1 ene 2004 año
48.295
+20.768
75.44%
1 ene 2005 año
31.367
-16.928
-35.05%
1 ene 2006 año
41.906
+10.539
33.6%
1 ene 2007 año
39.553
-2.353
-5.61%
1 ene 2009 año
34.528
-5.025
-12.7%
1 ene 2011 año
34.989
+0.461
1.34%
1 ene 2012 año
42.685
+7.695
21.99%
Ranking de los países por los datos estadísticos actuales


Comentarios: