29
/es/
es
AIzaSyAYiBZKx7MnpbEhh9jyipgxe19OcubqV5w
April 1, 2024
175367
Latvia
LVA
true
2
1
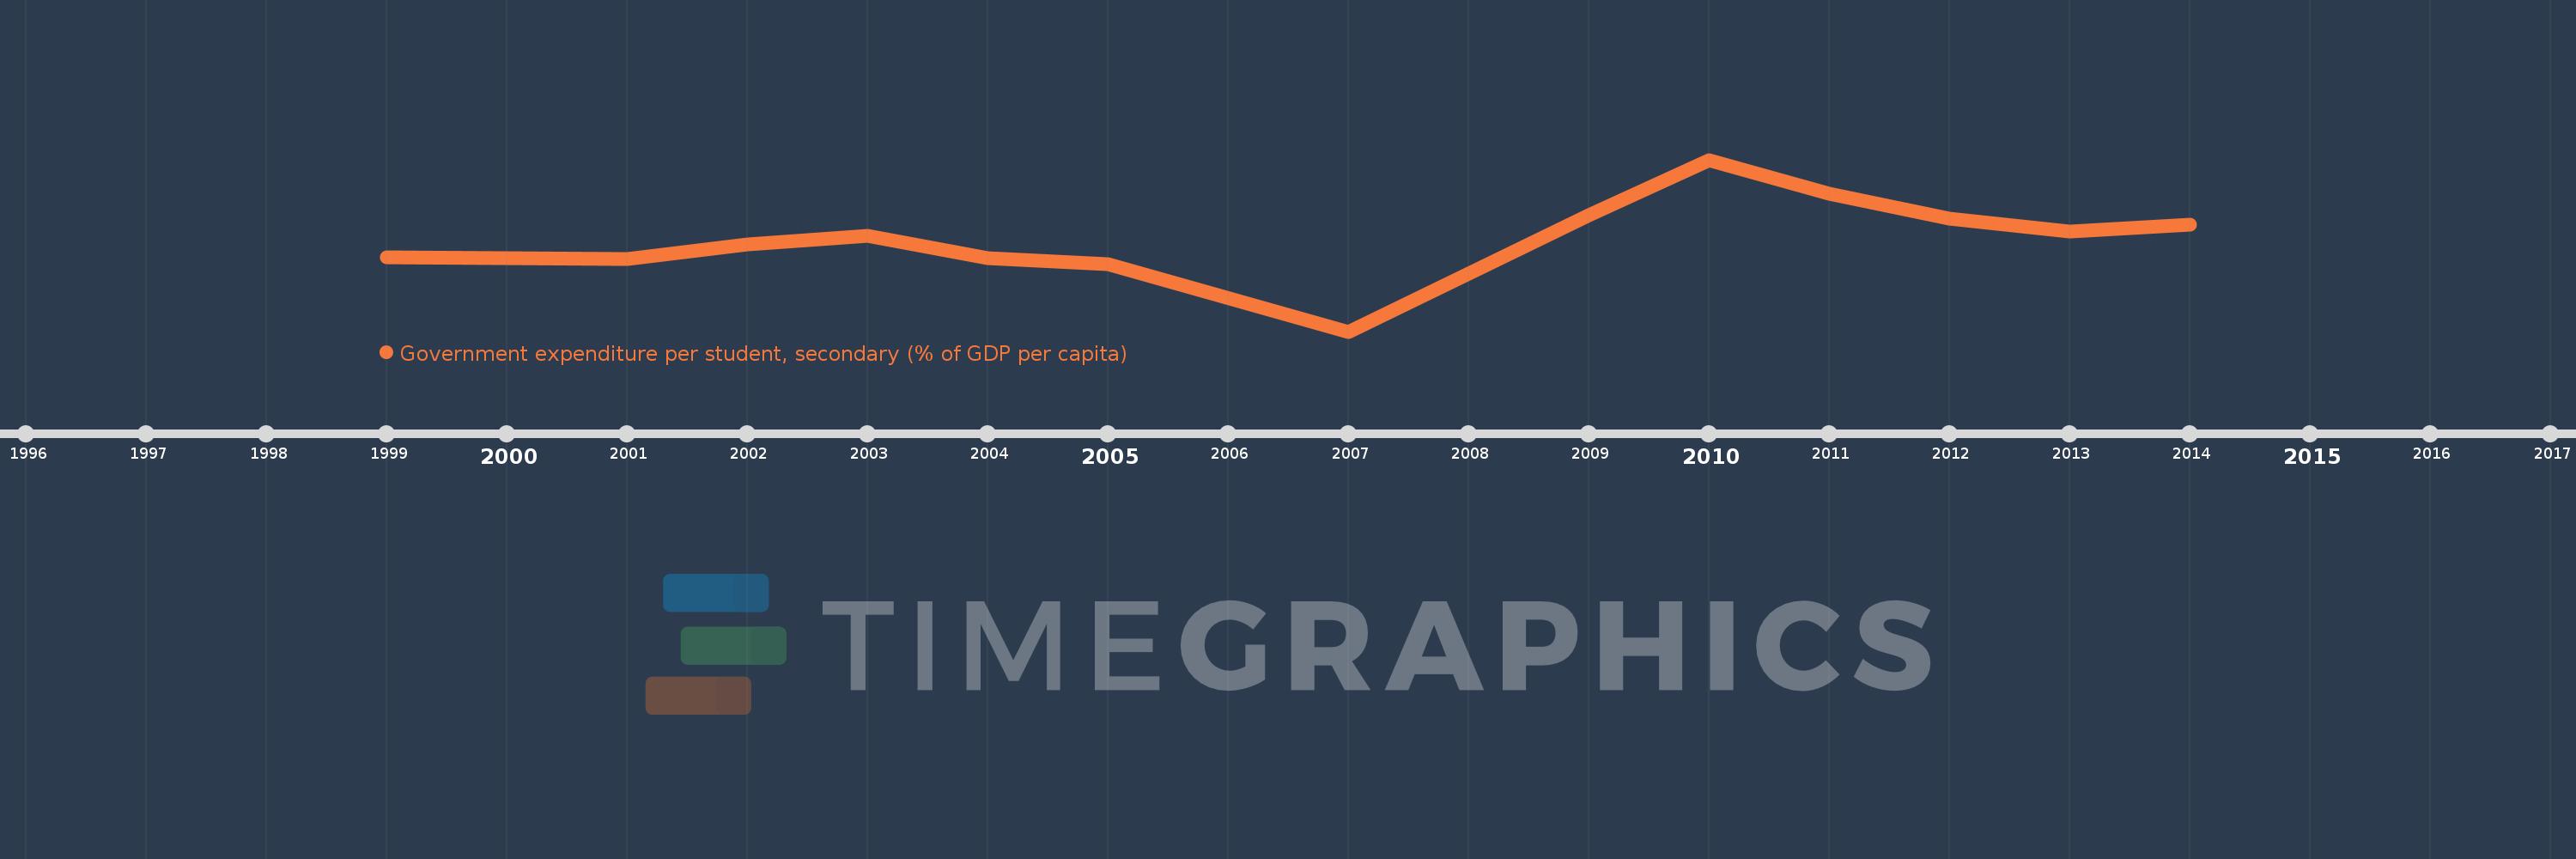
Government expenditure per student, secondary (% of GDP per capita)
2014,2013,2012,2011,2010,2009,2008,2007,2005,2004,2003,2002,2001,2000,1999
Estas estadísticas en otros países:
línea de tiempo (timeline):
En esta escala de tiempo se presenta un gráfico de 1999 y 2014 de Latvia. Los datos de 1998 están ausentes. El número de observaciones reales por fecha: 15.
Fuente (nombre):
Indicadores del desarrollo mundial
Fuente (organización):
United Nations Educational, Scientific, and Cultural Organization (UNESCO) Institute for Statistics.
Categorías:
Education
Se ha actualizado:
23 abr 2017 año
Los indicadores de los cambios de valor en los últimos años
Mínimo:
17.429
1 ene 2007 año
Máximo:
30.365
1 ene 2010 año
A la fecha de observación
Valor
Cambio absoluto
El cambio con respecto al valor anterior
1 ene 1999 año
23.047
+23.047
0.0%
1 ene 2000 año
22.985
-0.062
-0.27%
1 ene 2001 año
22.872
-0.114
-0.49%
1 ene 2002 año
24.021
+1.149
5.02%
1 ene 2003 año
24.644
+0.623
2.59%
1 ene 2004 año
22.962
-1.682
-6.82%
1 ene 2005 año
22.526
-0.436
-1.9%
1 ene 2007 año
17.429
-5.098
-22.63%
1 ene 2008 año
21.768
+4.339
24.9%
1 ene 2009 año
26.202
+4.433
20.37%
1 ene 2010 año
30.365
+4.164
15.89%
1 ene 2011 año
27.79
-2.575
-8.48%
1 ene 2012 año
25.909
-1.882
-6.77%
1 ene 2013 año
24.983
-0.926
-3.57%
1 ene 2014 año
25.506
+0.523
2.09%
Ranking de los países por los datos estadísticos actuales


Comentarios: