29
/fr/
fr
AIzaSyAYiBZKx7MnpbEhh9jyipgxe19OcubqV5w
April 1, 2024
160526
Israel
ISR
true
2
1
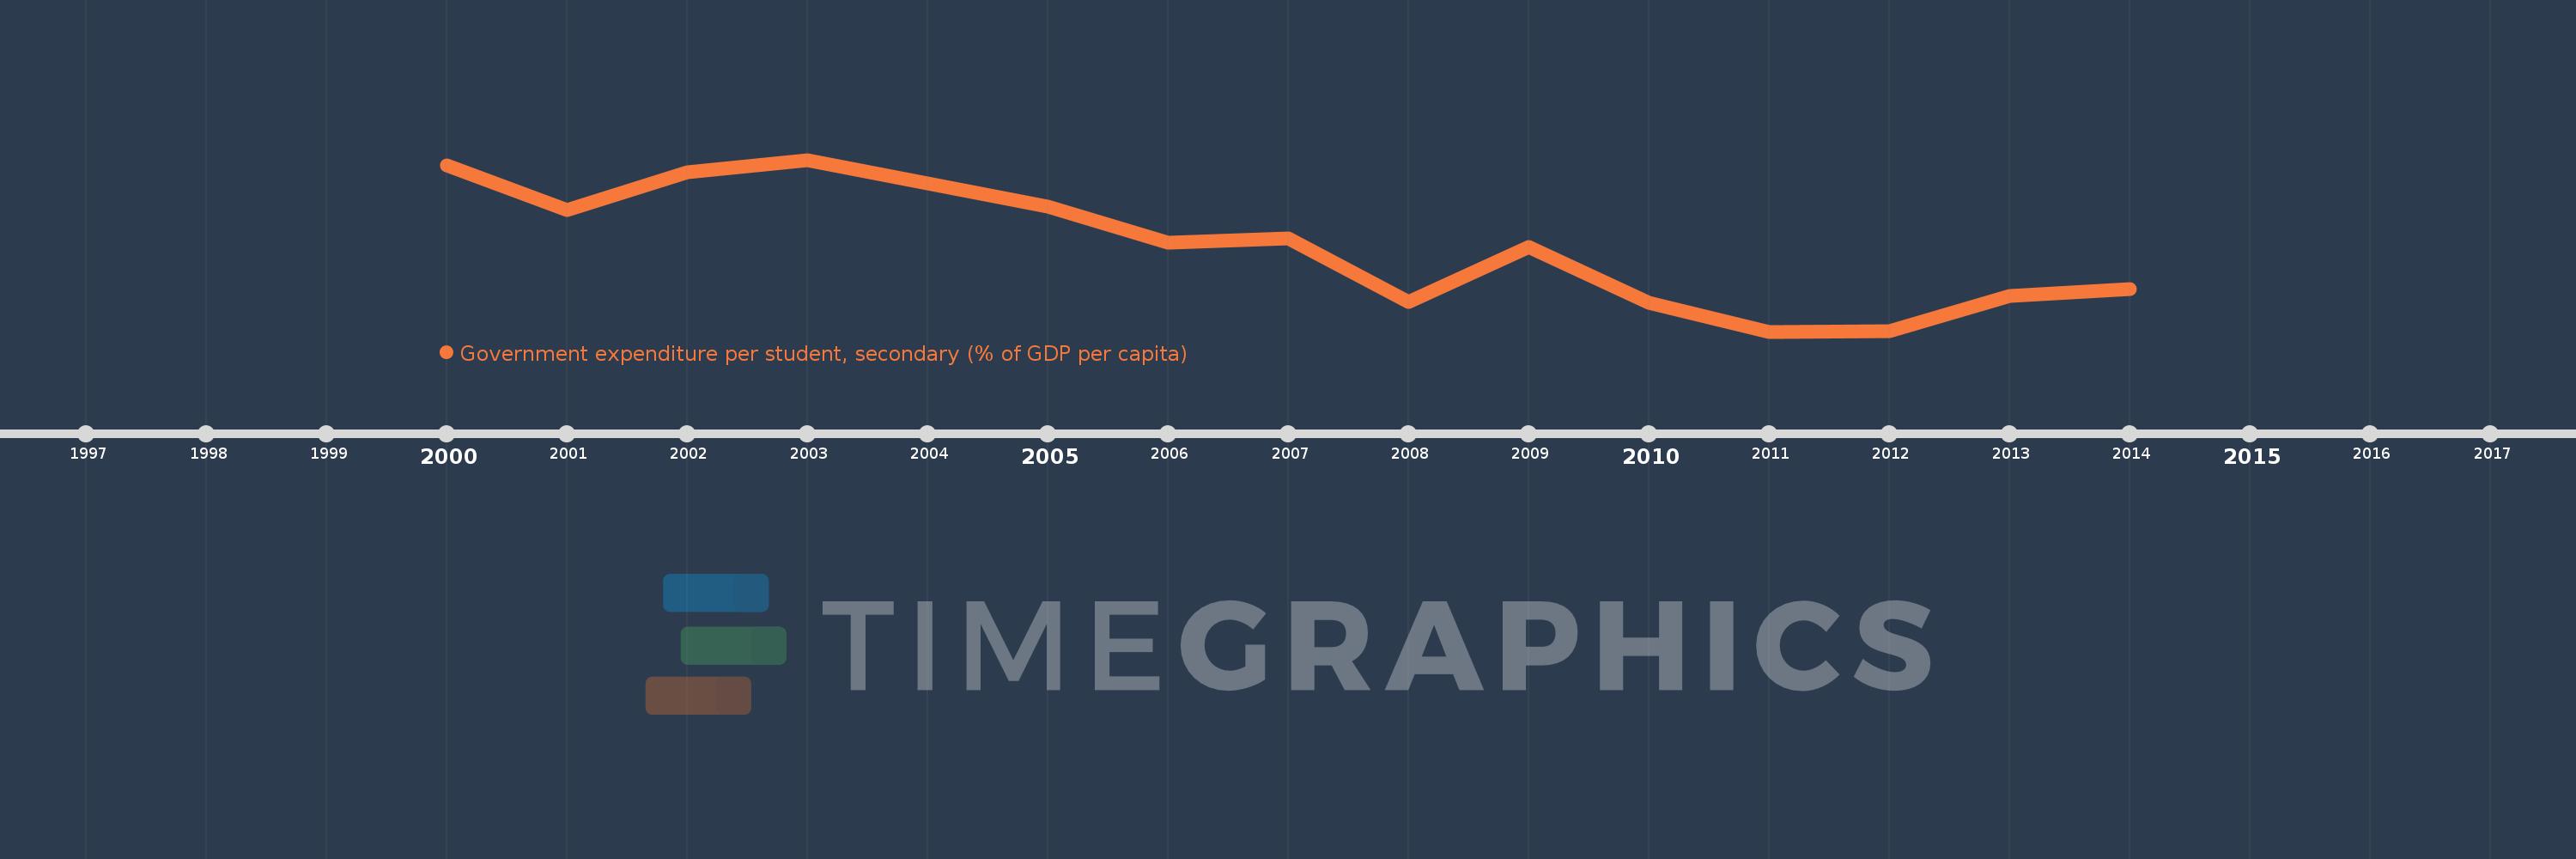
Government expenditure per student, secondary (% of GDP per capita)
2014,2013,2012,2011,2010,2009,2008,2007,2006,2005,2004,2003,2002,2001,2000
Cette statistique dans les autres pays:
La ligne de temps
Cette échelle de temps montre un graphique de 2000 année à 2014 année Israel. Les données jusqu'à 1999 année ne sont pas présentés. Quantité d'observations actuelles selon dates: 15.
Source (désignation):
Les indicateurs du développement mondiale
Source (organisation):
United Nations Educational, Scientific, and Cultural Organization (UNESCO) Institute for Statistics.
Catégories:
Education
Dernière mise à jour
23 avr. 2017
Les indicateurs de changement de valeurs selon les années
Minimum:
15.262
1 janv. 2011
Maximum:
18.83
1 janv. 2003
Pour la date d''observation
Valeur
Changement absolu
Le changement par rapport à la valeur précédente
1 janv. 2000
18.713
+18.713
0.0%
1 janv. 2001
17.782
-0.931
-4.97%
1 janv. 2002
18.563
+0.781
4.39%
1 janv. 2003
18.83
+0.268
1.44%
1 janv. 2004
18.333
-0.498
-2.64%
1 janv. 2005
17.853
-0.479
-2.61%
1 janv. 2006
17.11
-0.743
-4.16%
1 janv. 2007
17.197
+0.087
0.51%
1 janv. 2008
15.88
-1.317
-7.66%
1 janv. 2009
17.024
+1.144
7.2%
1 janv. 2010
15.867
-1.156
-6.79%
1 janv. 2011
15.262
-0.605
-3.81%
1 janv. 2012
15.266
+0.004
0.03%
1 janv. 2013
15.998
+0.733
4.8%
1 janv. 2014
16.153
+0.155
0.97%
Classement des pays selon les statistiques actuelles par années


Commentaires: