29
/es/
es
AIzaSyAYiBZKx7MnpbEhh9jyipgxe19OcubqV5w
April 1, 2024
108575
Comoros
COM
true
2
1
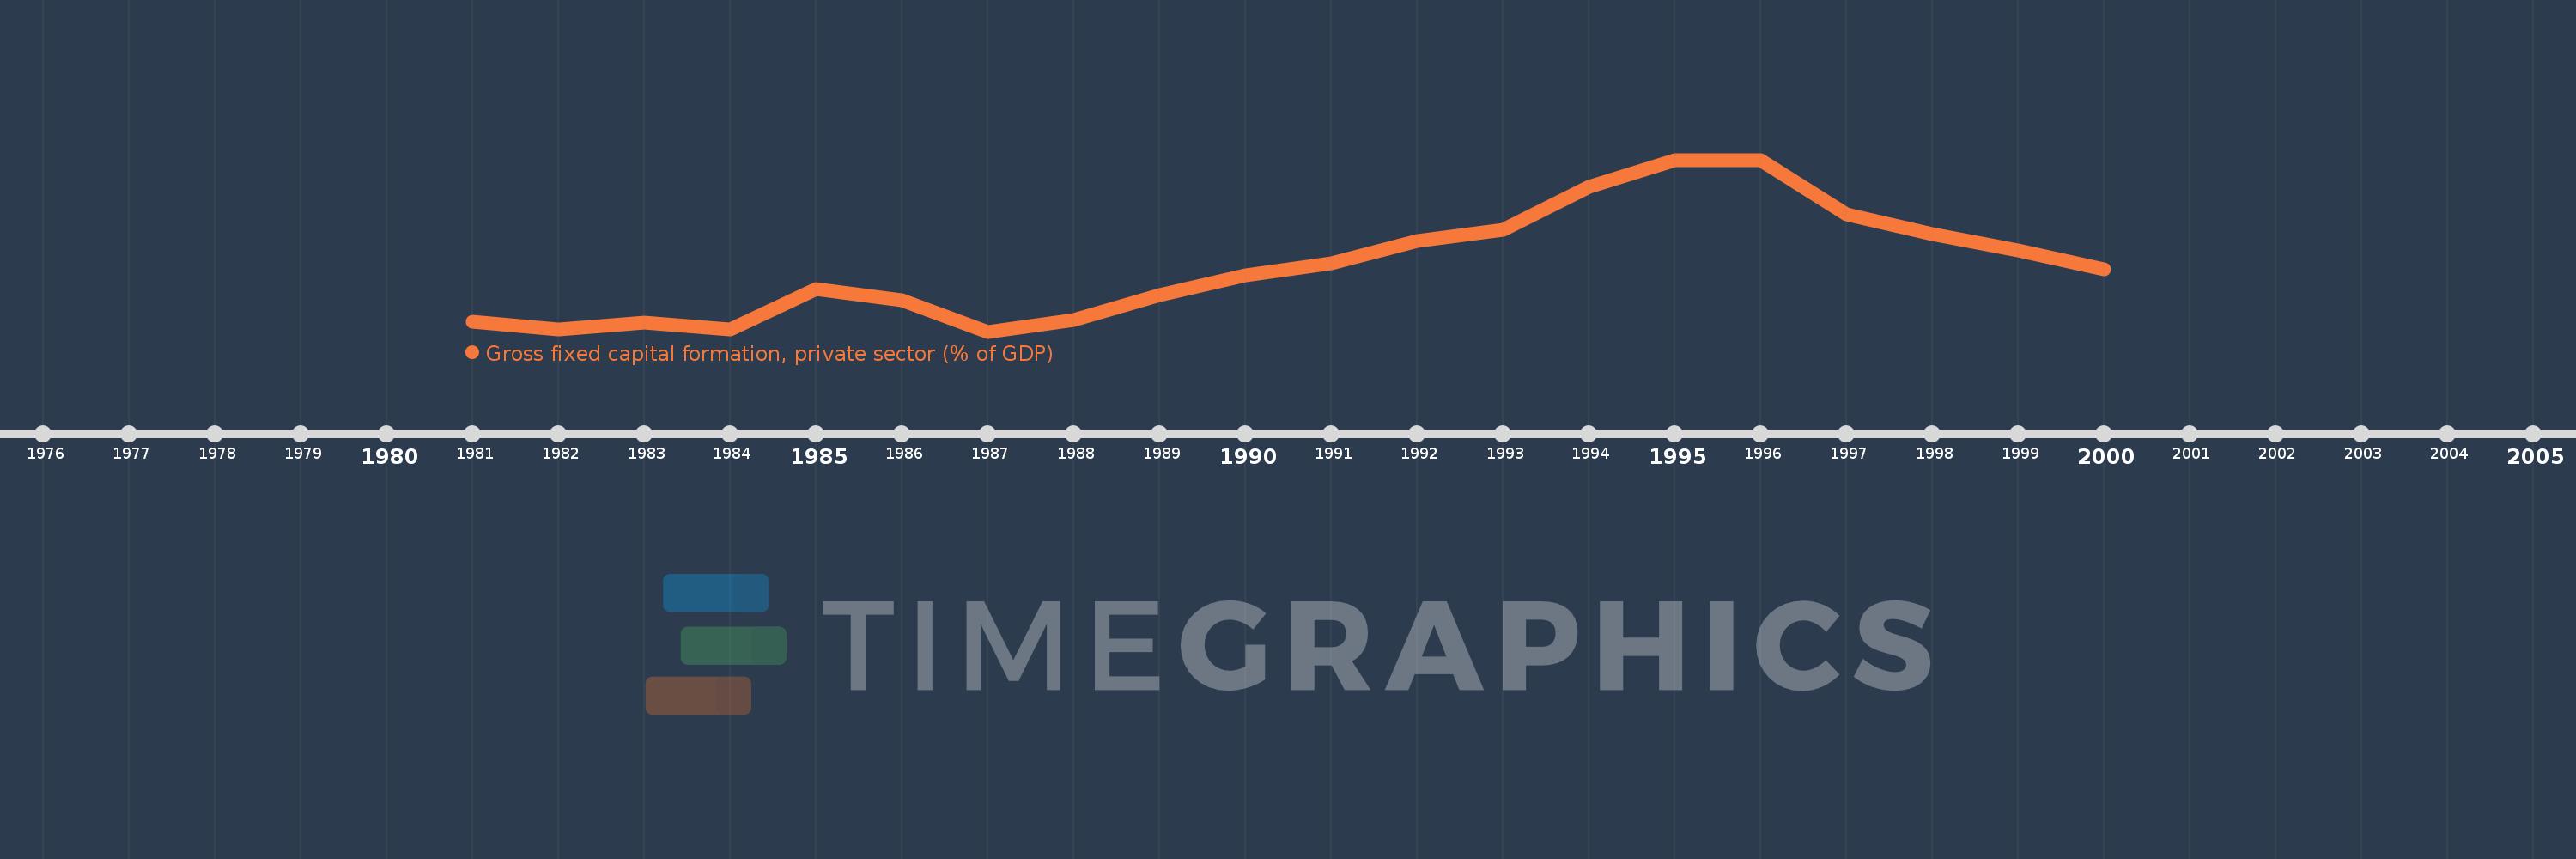
Gross fixed capital formation, private sector (% of GDP)
2000,1999,1998,1997,1996,1995,1994,1993,1992,1991,1990,1989,1988,1987,1986,1985,1984,1983,1982,1981
Estas estadísticas en otros países:
línea de tiempo (timeline):
En esta escala de tiempo se presenta un gráfico de 1981 y 2000 de Comoros. Los datos de 1980 están ausentes. El número de observaciones reales por fecha: 20.
Fuente (nombre):
Indicadores del desarrollo mundial
Fuente (organización):
World Bank national accounts data, and OECD National Accounts data files.
Categorías:
Economy & Growth
Se ha actualizado:
23 abr 2017 año
Los indicadores de los cambios de valor en los últimos años
Mínimo:
5.061
1 ene 1987 año
Máximo:
9.153
1 ene 1995 año
A la fecha de observación
Valor
Cambio absoluto
El cambio con respecto al valor anterior
1 ene 1981 año
5.3
+5.3
0.0%
1 ene 1982 año
5.111
-0.189
-3.57%
1 ene 1983 año
5.266
+0.155
3.03%
1 ene 1984 año
5.102
-0.164
-3.12%
1 ene 1985 año
6.083
+0.981
19.23%
1 ene 1986 año
5.809
-0.274
-4.5%
1 ene 1987 año
5.061
-0.748
-12.87%
1 ene 1988 año
5.332
+0.271
5.36%
1 ene 1989 año
5.928
+0.595
11.16%
1 ene 1990 año
6.407
+0.48
8.09%
1 ene 1991 año
6.681
+0.274
4.27%
1 ene 1992 año
7.214
+0.533
7.98%
1 ene 1993 año
7.487
+0.273
3.78%
1 ene 1994 año
8.5
+1.014
13.54%
1 ene 1995 año
9.153
+0.653
7.68%
1 ene 1996 año
9.14
-0.013
-0.14%
1 ene 1997 año
7.851
-1.289
-14.1%
1 ene 1998 año
7.378
-0.473
-6.03%
1 ene 1999 año
6.986
-0.392
-5.31%
1 ene 2000 año
6.543
-0.443
-6.34%
Ranking de los países por los datos estadísticos actuales


Comentarios: