29
/es/
es
AIzaSyAYiBZKx7MnpbEhh9jyipgxe19OcubqV5w
April 1, 2024
276708
United States
USA
true
2
1
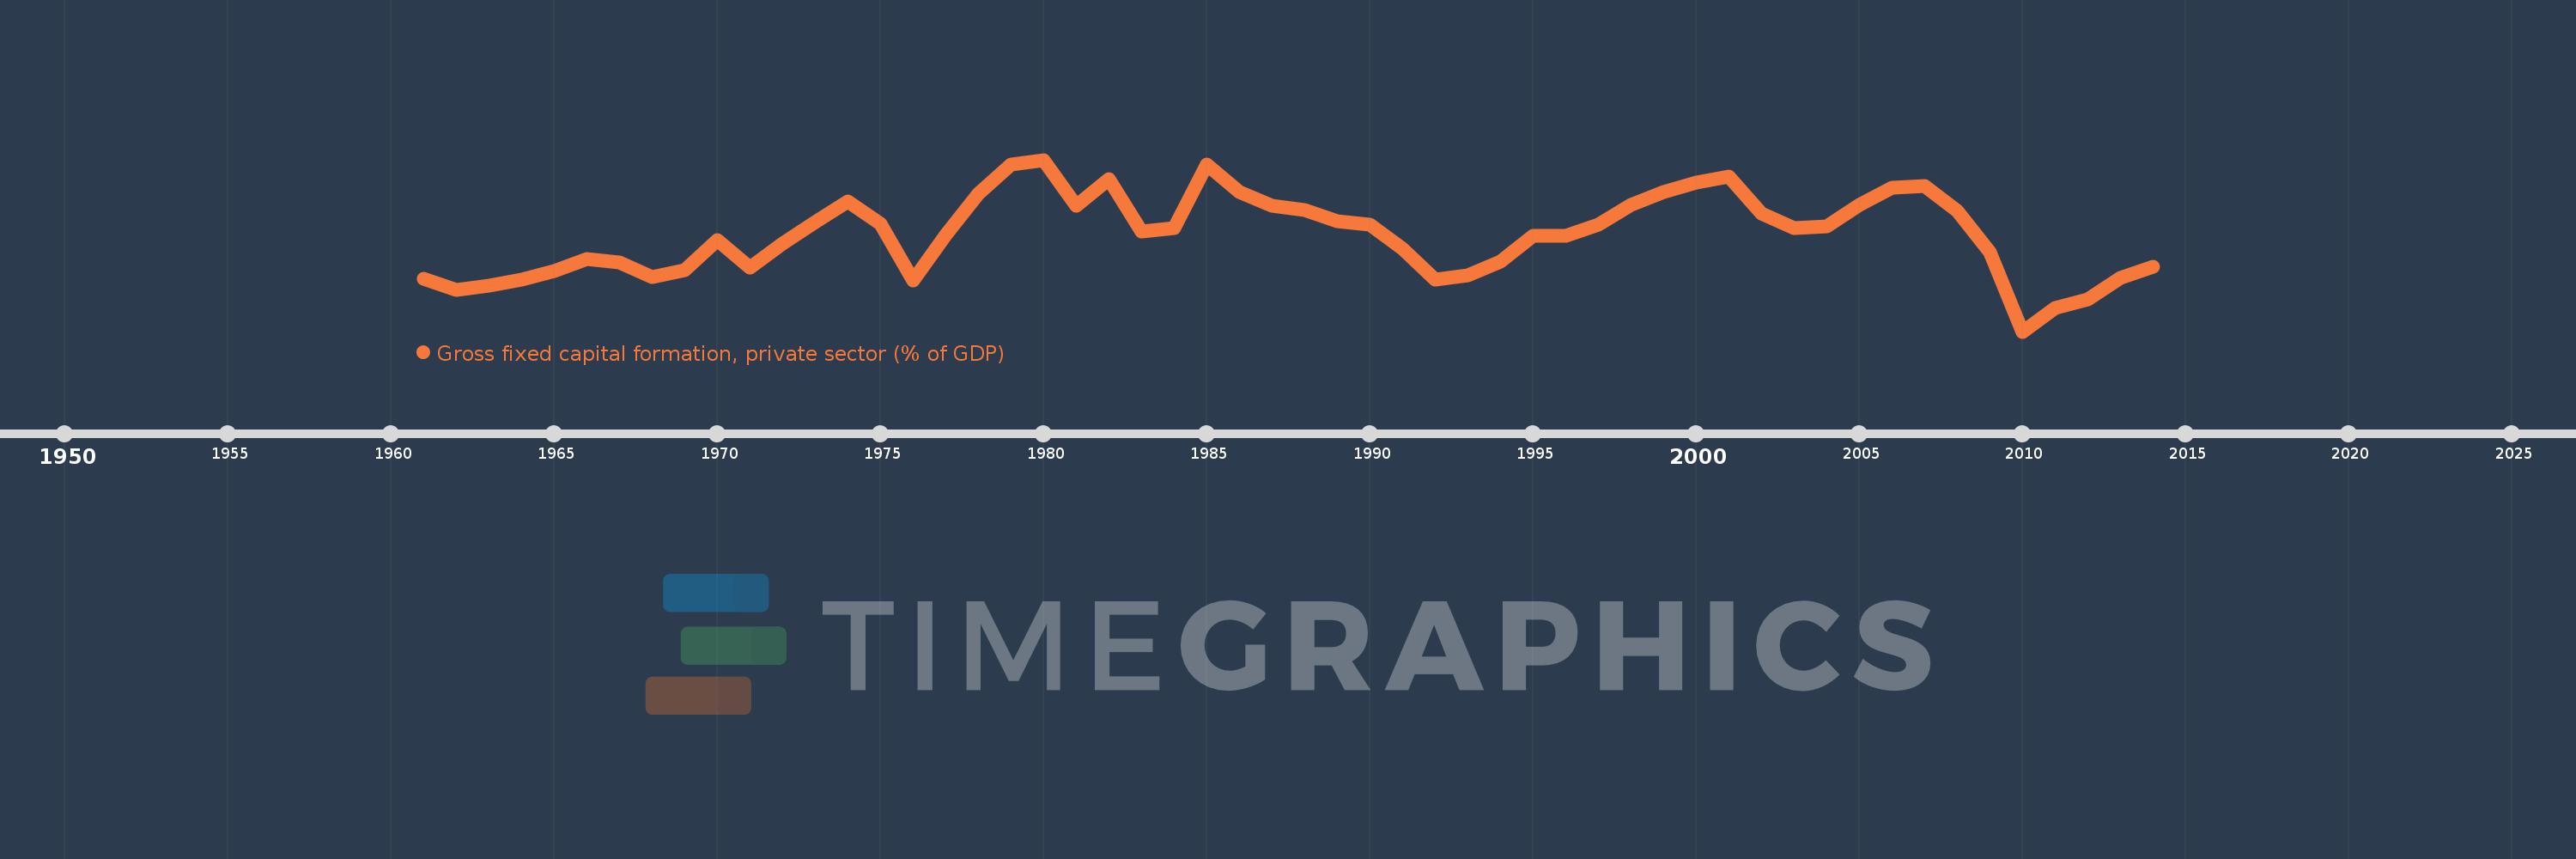
Gross fixed capital formation, private sector (% of GDP)
2014,2013,2012,2011,2010,2009,2008,2007,2006,2005,2004,2003,2002,2001,2000,1999,1998,1997,1996,1995,1994,1993,1992,1991,1990,1989,1988,1987,1986,1985,1984,1983,1982,1981,1980,1979,1978,1977,1976,1975,1974,1973,1972,1971,1970,1969,1968,1967,1966,1965,1964,1963,1962,1961
Estas estadísticas en otros países:
línea de tiempo (timeline):
En esta escala de tiempo se presenta un gráfico de 1961 y 2014 de United States. Los datos de 1960 están ausentes. El número de observaciones reales por fecha: 54.
Fuente (nombre):
Indicadores del desarrollo mundial
Fuente (organización):
World Bank national accounts data, and OECD National Accounts data files.
Categorías:
Economy & Growth
Se ha actualizado:
23 abr 2017 año
Los indicadores de los cambios de valor en los últimos años
Mínimo:
13.025
1 ene 2010 año
Máximo:
20.504
1 ene 1980 año
A la fecha de observación
Valor
Cambio absoluto
El cambio con respecto al valor anterior
1 ene 1961 año
15.314
+15.314
0.0%
1 ene 1962 año
14.841
-0.473
-3.09%
1 ene 1963 año
15.022
+0.181
1.22%
1 ene 1964 año
15.299
+0.277
1.84%
1 ene 1965 año
15.646
+0.347
2.27%
1 ene 1966 año
16.189
+0.543
3.47%
1 ene 1967 año
16.025
-0.165
-1.02%
1 ene 1968 año
15.411
-0.613
-3.83%
1 ene 1969 año
15.692
+0.281
1.82%
1 ene 1970 año
17.021
+1.329
8.47%
1 ene 1971 año
15.81
-1.211
-7.11%
1 ene 1972 año
16.853
+1.042
6.59%
1 ene 1973 año
17.786
+0.934
5.54%
1 ene 1974 año
18.683
+0.897
5.04%
1 ene 1975 año
17.723
-0.96
-5.14%
1 ene 1976 año
15.235
-2.489
-14.04%
1 ene 1977 año
17.214
+1.979
12.99%
1 ene 1978 año
19.013
+1.799
10.45%
1 ene 1979 año
20.301
+1.288
6.77%
1 ene 1980 año
20.504
+0.204
1.0%
1 ene 1981 año
18.519
-1.985
-9.68%
1 ene 1982 año
19.658
+1.139
6.15%
1 ene 1983 año
17.369
-2.288
-11.64%
1 ene 1984 año
17.523
+0.153
0.88%
1 ene 1985 año
20.296
+2.773
15.83%
1 ene 1986 año
19.086
-1.21
-5.96%
1 ene 1987 año
18.498
-0.587
-3.08%
1 ene 1988 año
18.32
-0.179
-0.97%
1 ene 1989 año
17.839
-0.481
-2.62%
1 ene 1990 año
17.67
-0.169
-0.95%
1 ene 1991 año
16.615
-1.055
-5.97%
1 ene 1992 año
15.295
-1.32
-7.95%
1 ene 1993 año
15.491
+0.196
1.28%
1 ene 1994 año
16.09
+0.599
3.87%
1 ene 1995 año
17.192
+1.102
6.85%
1 ene 1996 año
17.191
-0.001
-0.01%
1 ene 1997 año
17.68
+0.489
2.85%
1 ene 1998 año
18.535
+0.855
4.84%
1 ene 1999 año
19.092
+0.557
3.0%
1 ene 2000 año
19.504
+0.412
2.16%
1 ene 2001 año
19.775
+0.271
1.39%
1 ene 2002 año
18.157
-1.618
-8.18%
1 ene 2003 año
17.536
-0.621
-3.42%
1 ene 2004 año
17.618
+0.082
0.47%
1 ene 2005 año
18.548
+0.93
5.28%
1 ene 2006 año
19.3
+0.753
4.06%
1 ene 2007 año
19.346
+0.046
0.24%
1 ene 2008 año
18.261
-1.086
-5.61%
1 ene 2009 año
16.474
-1.786
-9.78%
1 ene 2010 año
13.025
-3.449
-20.94%
1 ene 2011 año
14.039
+1.013
7.78%
1 ene 2012 año
14.434
+0.396
2.82%
1 ene 2013 año
15.346
+0.912
6.32%
1 ene 2014 año
15.864
+0.518
3.38%
Ranking de los países por los datos estadísticos actuales


Comentarios: