29
/es/
es
AIzaSyAYiBZKx7MnpbEhh9jyipgxe19OcubqV5w
April 1, 2024
199206
Mongolia
MNG
true
2
1
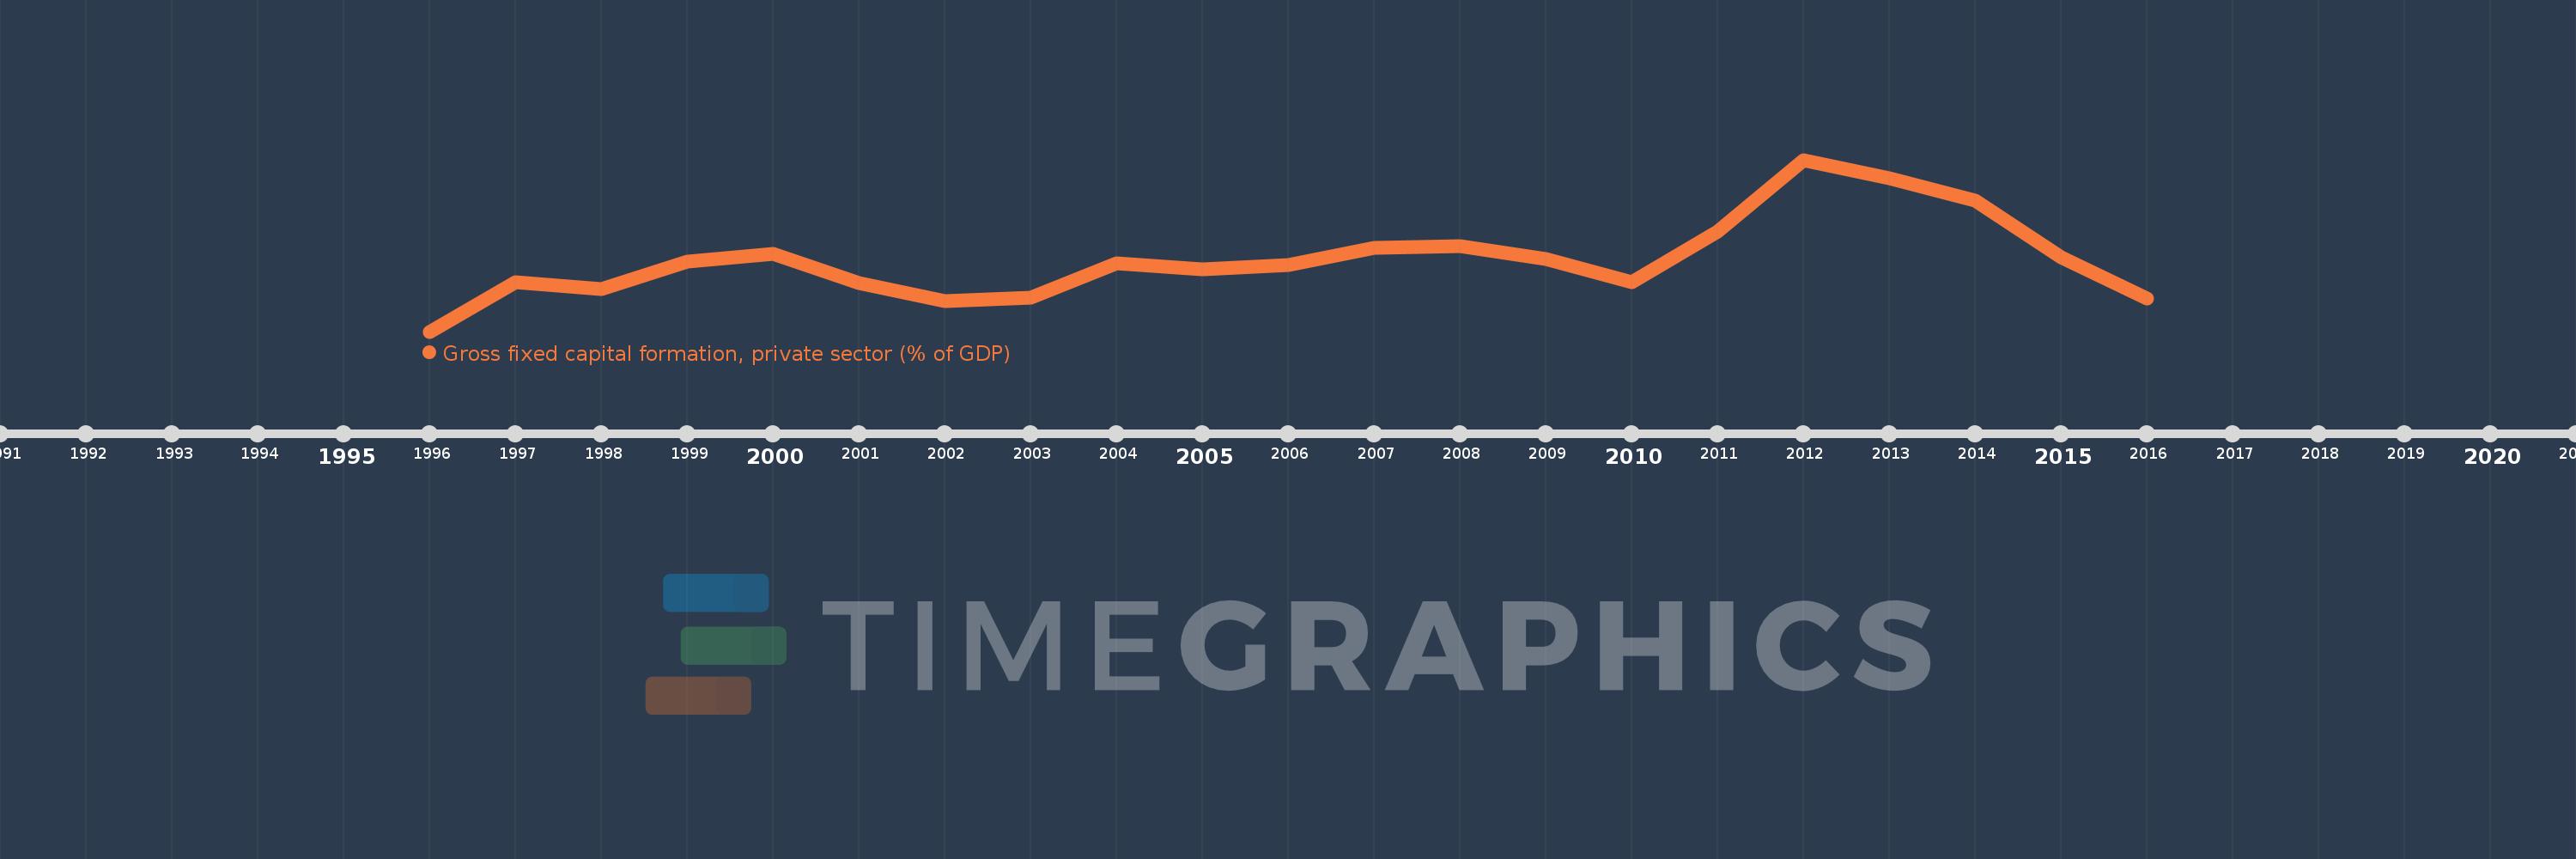
Gross fixed capital formation, private sector (% of GDP)
2016,2015,2014,2013,2012,2011,2010,2009,2008,2007,2006,2005,2004,2003,2002,2001,2000,1999,1998,1997,1996
Estas estadísticas en otros países:
línea de tiempo (timeline):
En esta escala de tiempo se presenta un gráfico de 1996 y 2016 de Mongolia. Los datos de 1995 están ausentes. El número de observaciones reales por fecha: 21.
Fuente (nombre):
Indicadores del desarrollo mundial
Fuente (organización):
World Bank national accounts data, and OECD National Accounts data files.
Categorías:
Economy & Growth
Se ha actualizado:
23 abr 2017 año
Los indicadores de los cambios de valor en los últimos años
Mínimo:
12.494
1 ene 1996 año
Máximo:
46.905
1 ene 2012 año
A la fecha de observación
Valor
Cambio absoluto
El cambio con respecto al valor anterior
1 ene 1996 año
12.494
+12.494
0.0%
1 ene 1997 año
22.403
+9.909
79.31%
1 ene 1998 año
20.93
-1.473
-6.57%
1 ene 1999 año
26.569
+5.639
26.94%
1 ene 2000 año
28.11
+1.541
5.8%
1 ene 2001 año
22.242
-5.869
-20.88%
1 ene 2002 año
18.601
-3.641
-16.37%
1 ene 2003 año
19.295
+0.694
3.73%
1 ene 2004 año
26.112
+6.817
35.33%
1 ene 2005 año
24.896
-1.216
-4.66%
1 ene 2006 año
25.807
+0.911
3.66%
1 ene 2007 año
29.262
+3.455
13.39%
1 ene 2008 año
29.537
+0.275
0.94%
1 ene 2009 año
26.998
-2.539
-8.59%
1 ene 2010 año
22.305
-4.693
-17.38%
1 ene 2011 año
32.574
+10.269
46.04%
1 ene 2012 año
46.905
+14.331
43.99%
1 ene 2013 año
43.257
-3.648
-7.78%
1 ene 2014 año
38.779
-4.477
-10.35%
1 ene 2015 año
27.294
-11.485
-29.62%
1 ene 2016 año
19.08
-8.214
-30.1%
Ranking de los países por los datos estadísticos actuales


Comentarios: