29
/de/
de
AIzaSyAYiBZKx7MnpbEhh9jyipgxe19OcubqV5w
April 1, 2024
95733
Burundi
BDI
true
2
1
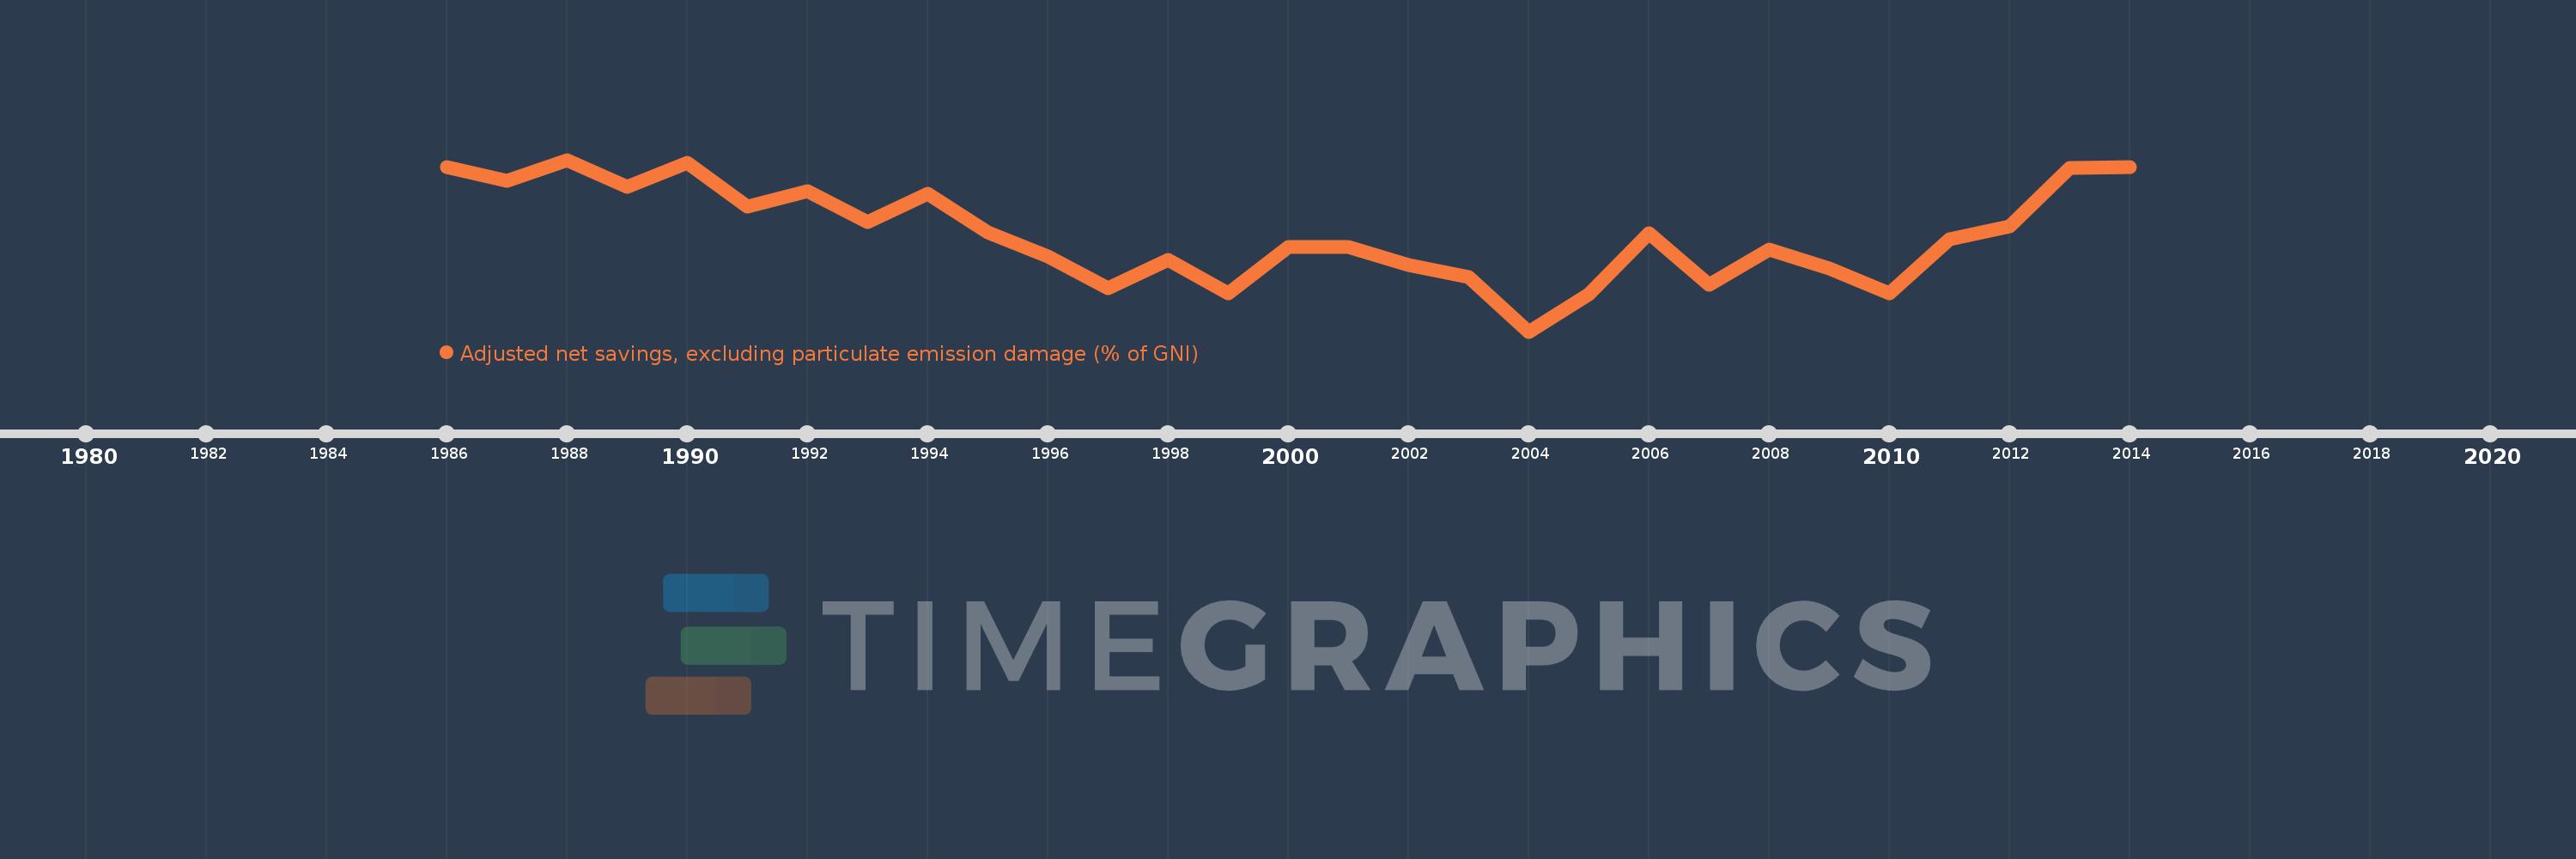
Adjusted net savings, excluding particulate emission damage (% of GNI)
2014,2013,2012,2011,2010,2009,2008,2007,2006,2005,2004,2003,2002,2001,2000,1999,1998,1997,1996,1995,1994,1993,1992,1991,1990,1989,1988,1987,1986
Diese Statistik in anderen Ländern:
AfghanistanAlbaniaAlgeriaAngolaArab WorldArgentinaArmeniaAustraliaAustriaAzerbaijanBahamas, TheBahrainBangladeshBarbadosBelarusBelgiumBelizeBeninBhutanBoliviaBotswanaBrazilBrunei DarussalamBulgariaBurkina FasoBurundiCabo VerdeCambodiaCameroonCanadaCaribbean small statesCentral African RepublicCentral Europe and the BalticsChadChileChinaColombiaComorosCongo, Dem. Rep.Congo, Rep.Costa RicaCote d'IvoireCroatiaCyprusCzech RepublicDenmarkDjiboutiDominicaDominican RepublicEarly-demographic dividendEast Asia & PacificEast Asia & Pacific (excluding high income)East Asia & Pacific (IDA & IBRD countries)EcuadorEgypt, Arab Rep.El SalvadorEquatorial GuineaEritreaEstoniaEthiopiaEuro areaEurope & Central AsiaEurope & Central Asia (excluding high income)Europe & Central Asia (IDA & IBRD countries)European UnionFijiFinlandFragile and conflict affected situationsFranceGabonGambia, TheGeorgiaGermanyGhanaGreeceGuatemalaGuineaGuinea-BissauGuyanaHaitiHeavily indebted poor countries (HIPC)High incomeHondurasHungaryIBRD onlyIcelandIDA & IBRD totalIDA blendIDA onlyIDA totalIndiaIndonesiaIran, Islamic Rep.IraqIrelandIsraelItalyJamaicaJapanJordanKazakhstanKenyaKiribatiKorea, Rep.KuwaitKyrgyz RepublicLao PDRLate-demographic dividendLatin America & Caribbean Latin America & Caribbean (excluding high income)Latin America & the Caribbean (IDA & IBRD countries)LatviaLeast developed countries: UN classificationLebanonLesothoLiberiaLibyaLithuaniaLow & middle incomeLow incomeLower middle incomeLuxembourgMacedonia, FYRMadagascarMalawiMalaysiaMaldivesMaliMauritaniaMauritiusMexicoMiddle East & North AfricaMiddle East & North Africa (excluding high income)Middle East & North Africa (IDA & IBRD countries)Middle incomeMoldovaMongoliaMoroccoMozambiqueNamibiaNepalNetherlandsNew ZealandNicaraguaNigerNigeriaNorth AmericaNorwayOECD membersOmanOther small statesPacific island small statesPakistanPanamaPapua New GuineaParaguayPeruPhilippinesPolandPortugalPost-demographic dividendPre-demographic dividendQatarRomaniaRussian FederationRwandaSaudi ArabiaSenegalSeychellesSierra LeoneSingaporeSlovak RepublicSloveniaSmall statesSolomon IslandsSouth AfricaSouth AsiaSouth Asia (IDA & IBRD)SpainSri LankaSt. LuciaSt. Vincent and the GrenadinesSub-Saharan Africa Sub-Saharan Africa (excluding high income)Sub-Saharan Africa (IDA & IBRD countries)SudanSurinameSwazilandSwedenSwitzerlandSyrian Arab RepublicTajikistanTanzaniaThailandTogoTongaTrinidad and TobagoTunisiaTurkeyUgandaUkraineUnited KingdomUnited StatesUpper middle incomeUruguayVanuatuVenezuela, RBVietnamWorldYemen, Rep.ZambiaZimbabwe Zeitlinie:
Diese Zeitleiste vorliegt die Graphik ab 1986 J. bis 2014 J. Burundi. Die Angaben bis 1985 J. sind nicht vorhanden. Die Zahl aktueller Beobachtungen nach Daten: 29.
Die Quelle (Bezeichnung):
Kennzahlen der Weltentwicklung
Die Quelle (Einrichtung):
World Bank staff estimates based on sources and methods in World Bank's "The Changing Wealth of Nations: Measuring Sustainable Development in the New Millennium" (2011).
Kategorien:
Economy & Growth, Environment
Es wurde aktualisiert:
23 Apr 2017 Jahr
Kennzahlen der Wertänderungen vom Jahr zum Jahr
Minimum:
-49.425
1 Jan 2004 Jahr
Maximum:
-5.62
1 Jan 1988 Jahr
Zum Datum der Beobachtung
Wert
Absolute Veränderung
Die Veränderung bezüglich dem vorherigen Wert
1 Jan 1986 Jahr
-7.504
-7.504
0.0%
1 Jan 1987 Jahr
-11.016
-3.512
46.8%
1 Jan 1988 Jahr
-5.62
+5.395
-48.98%
1 Jan 1989 Jahr
-12.469
-6.849
121.86%
1 Jan 1990 Jahr
-6.372
+6.097
-48.9%
1 Jan 1991 Jahr
-17.498
-11.126
174.6%
1 Jan 1992 Jahr
-13.715
+3.784
-21.62%
1 Jan 1993 Jahr
-21.471
-7.756
56.55%
1 Jan 1994 Jahr
-14.282
+7.189
-33.48%
1 Jan 1995 Jahr
-24.052
-9.771
68.41%
1 Jan 1996 Jahr
-30.25
-6.198
25.77%
1 Jan 1997 Jahr
-38.291
-8.041
26.58%
1 Jan 1998 Jahr
-31.154
+7.137
-18.64%
1 Jan 1999 Jahr
-39.709
-8.555
27.46%
1 Jan 2000 Jahr
-27.778
+11.932
-30.05%
1 Jan 2001 Jahr
-27.942
-0.165
0.59%
1 Jan 2002 Jahr
-32.557
-4.614
16.51%
1 Jan 2003 Jahr
-35.503
-2.947
9.05%
1 Jan 2004 Jahr
-49.425
-13.922
39.21%
1 Jan 2005 Jahr
-39.812
+9.613
-19.45%
1 Jan 2006 Jahr
-24.346
+15.466
-38.85%
1 Jan 2007 Jahr
-37.563
-13.217
54.29%
1 Jan 2008 Jahr
-28.594
+8.969
-23.88%
1 Jan 2009 Jahr
-33.381
-4.787
16.74%
1 Jan 2010 Jahr
-39.633
-6.252
18.73%
1 Jan 2011 Jahr
-25.832
+13.801
-34.82%
1 Jan 2012 Jahr
-22.591
+3.241
-12.55%
1 Jan 2013 Jahr
-7.724
+14.867
-65.81%
1 Jan 2014 Jahr
-7.415
+0.309
-4.0%
Bewertung der Länder gemäß mit laufender Statistik nach Jahren


Kommentare: