29
/de/
de
AIzaSyAYiBZKx7MnpbEhh9jyipgxe19OcubqV5w
April 1, 2024
198688
Mongolia
MNG
true
2
1
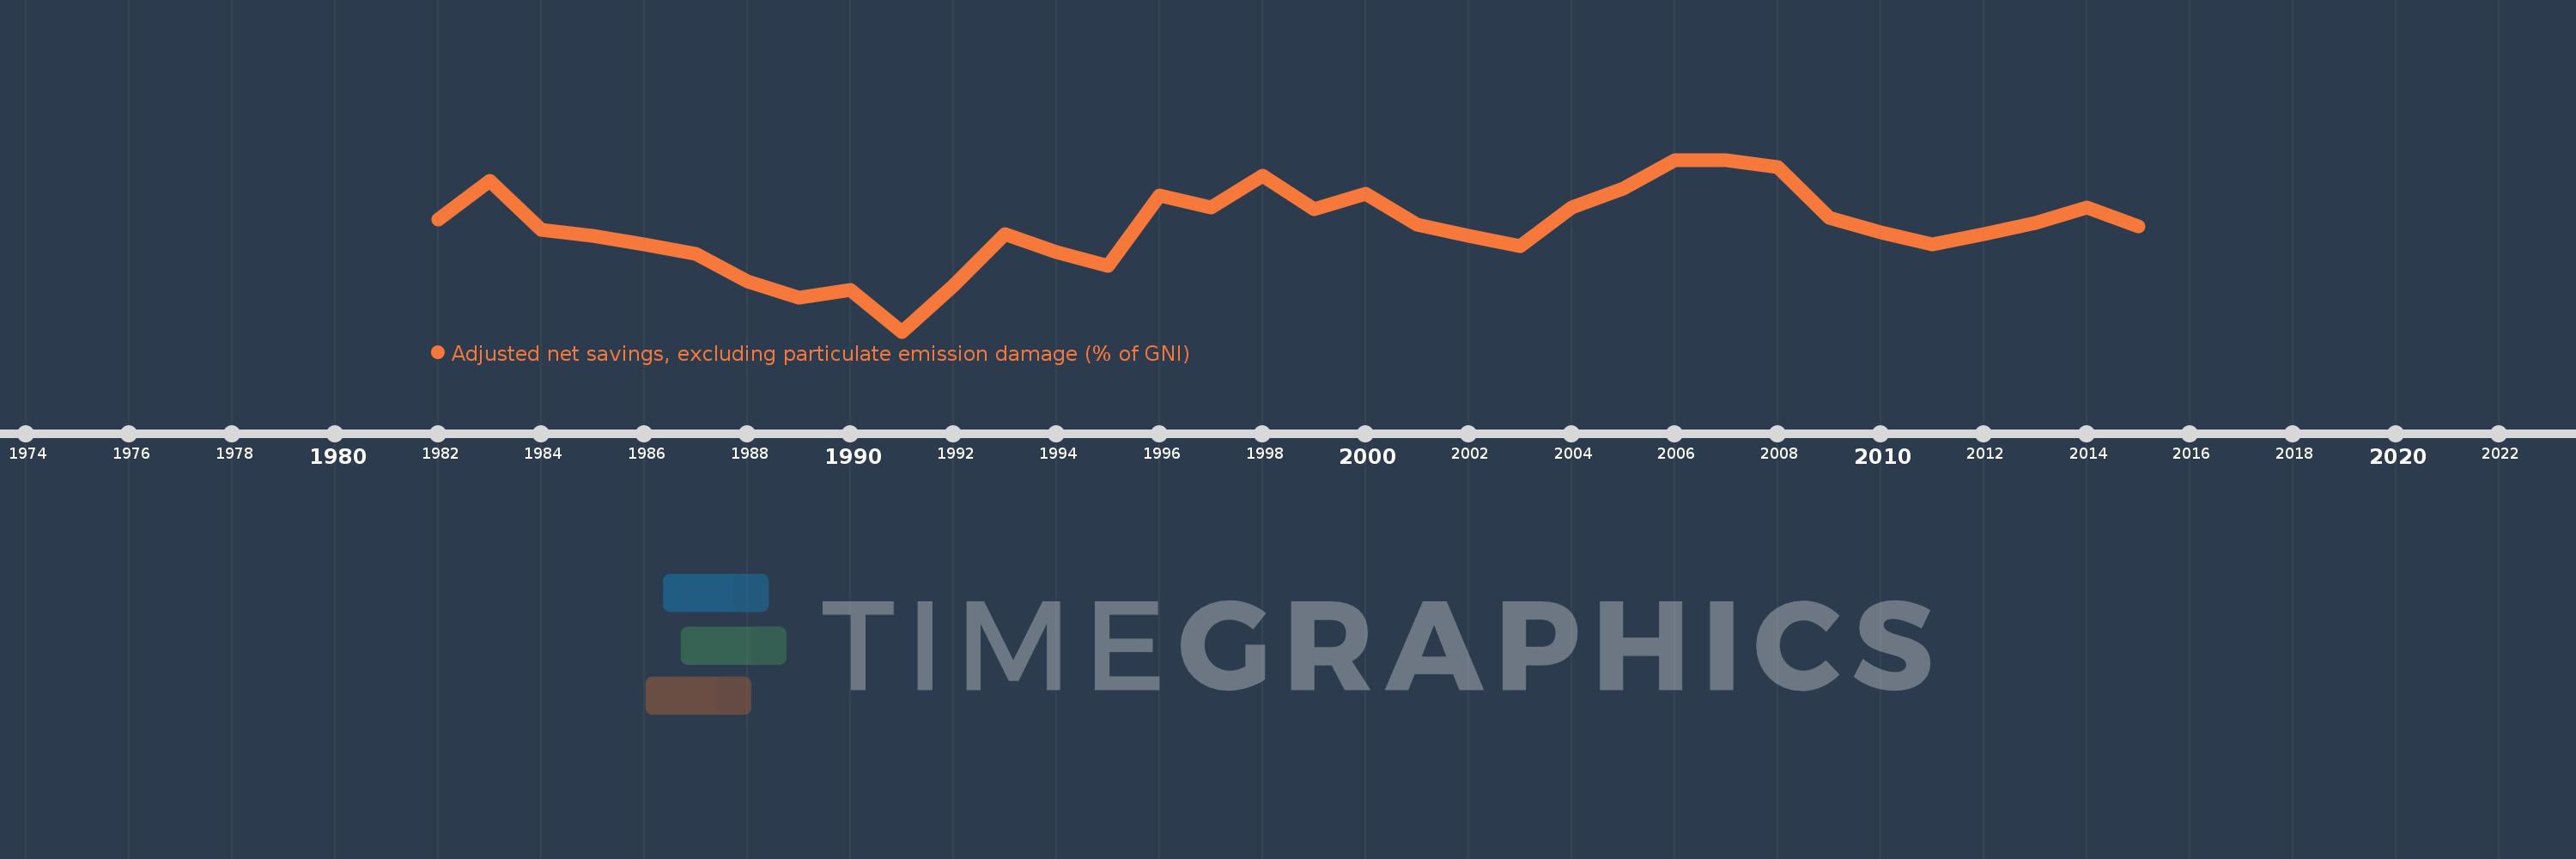
Adjusted net savings, excluding particulate emission damage (% of GNI)
2015,2014,2013,2012,2011,2010,2009,2008,2007,2006,2005,2004,2003,2002,2001,2000,1999,1998,1997,1996,1995,1994,1993,1992,1991,1990,1989,1988,1987,1986,1985,1984,1983,1982
Diese Statistik in anderen Ländern:
AfghanistanAlbaniaAlgeriaAngolaArab WorldArgentinaArmeniaAustraliaAustriaAzerbaijanBahamas, TheBahrainBangladeshBarbadosBelarusBelgiumBelizeBeninBhutanBoliviaBotswanaBrazilBrunei DarussalamBulgariaBurkina FasoBurundiCabo VerdeCambodiaCameroonCanadaCaribbean small statesCentral African RepublicCentral Europe and the BalticsChadChileChinaColombiaComorosCongo, Dem. Rep.Congo, Rep.Costa RicaCote d'IvoireCroatiaCyprusCzech RepublicDenmarkDjiboutiDominicaDominican RepublicEarly-demographic dividendEast Asia & PacificEast Asia & Pacific (excluding high income)East Asia & Pacific (IDA & IBRD countries)EcuadorEgypt, Arab Rep.El SalvadorEquatorial GuineaEritreaEstoniaEthiopiaEuro areaEurope & Central AsiaEurope & Central Asia (excluding high income)Europe & Central Asia (IDA & IBRD countries)European UnionFijiFinlandFragile and conflict affected situationsFranceGabonGambia, TheGeorgiaGermanyGhanaGreeceGuatemalaGuineaGuinea-BissauGuyanaHaitiHeavily indebted poor countries (HIPC)High incomeHondurasHungaryIBRD onlyIcelandIDA & IBRD totalIDA blendIDA onlyIDA totalIndiaIndonesiaIran, Islamic Rep.IraqIrelandIsraelItalyJamaicaJapanJordanKazakhstanKenyaKiribatiKorea, Rep.KuwaitKyrgyz RepublicLao PDRLate-demographic dividendLatin America & Caribbean Latin America & Caribbean (excluding high income)Latin America & the Caribbean (IDA & IBRD countries)LatviaLeast developed countries: UN classificationLebanonLesothoLiberiaLibyaLithuaniaLow & middle incomeLow incomeLower middle incomeLuxembourgMacedonia, FYRMadagascarMalawiMalaysiaMaldivesMaliMauritaniaMauritiusMexicoMiddle East & North AfricaMiddle East & North Africa (excluding high income)Middle East & North Africa (IDA & IBRD countries)Middle incomeMoldovaMongoliaMoroccoMozambiqueNamibiaNepalNetherlandsNew ZealandNicaraguaNigerNigeriaNorth AmericaNorwayOECD membersOmanOther small statesPacific island small statesPakistanPanamaPapua New GuineaParaguayPeruPhilippinesPolandPortugalPost-demographic dividendPre-demographic dividendQatarRomaniaRussian FederationRwandaSaudi ArabiaSenegalSeychellesSierra LeoneSingaporeSlovak RepublicSloveniaSmall statesSolomon IslandsSouth AfricaSouth AsiaSouth Asia (IDA & IBRD)SpainSri LankaSt. LuciaSt. Vincent and the GrenadinesSub-Saharan Africa Sub-Saharan Africa (excluding high income)Sub-Saharan Africa (IDA & IBRD countries)SudanSurinameSwazilandSwedenSwitzerlandSyrian Arab RepublicTajikistanTanzaniaThailandTogoTongaTrinidad and TobagoTunisiaTurkeyUgandaUkraineUnited KingdomUnited StatesUpper middle incomeUruguayVanuatuVenezuela, RBVietnamWorldYemen, Rep.ZambiaZimbabwe Zeitlinie:
Diese Zeitleiste vorliegt die Graphik ab 1982 J. bis 2015 J. Mongolia. Die Angaben bis 1981 J. sind nicht vorhanden. Die Zahl aktueller Beobachtungen nach Daten: 34.
Die Quelle (Bezeichnung):
Kennzahlen der Weltentwicklung
Die Quelle (Einrichtung):
World Bank staff estimates based on sources and methods in World Bank's "The Changing Wealth of Nations: Measuring Sustainable Development in the New Millennium" (2011).
Kategorien:
Economy & Growth, Environment
Es wurde aktualisiert:
23 Apr 2017 Jahr
Kennzahlen der Wertänderungen vom Jahr zum Jahr
Minimum:
-14.579
1 Jan 1991 Jahr
Maximum:
23.943
1 Jan 2007 Jahr
Zum Datum der Beobachtung
Wert
Absolute Veränderung
Die Veränderung bezüglich dem vorherigen Wert
1 Jan 1982 Jahr
10.526
+10.526
0.0%
1 Jan 1983 Jahr
19.292
+8.766
83.28%
1 Jan 1984 Jahr
8.33
-10.961
-56.82%
1 Jan 1985 Jahr
6.885
-1.445
-17.35%
1 Jan 1986 Jahr
4.966
-1.919
-27.88%
1 Jan 1987 Jahr
2.838
-2.127
-42.84%
1 Jan 1988 Jahr
-3.395
-6.233
-219.6%
1 Jan 1989 Jahr
-6.979
-3.584
105.57%
1 Jan 1990 Jahr
-5.316
+1.663
-23.83%
1 Jan 1991 Jahr
-14.579
-9.263
174.26%
1 Jan 1992 Jahr
-4.23
+10.348
-70.98%
1 Jan 1993 Jahr
7.268
+11.498
-271.79%
1 Jan 1994 Jahr
3.278
-3.989
-54.89%
1 Jan 1995 Jahr
0.157
-3.121
-95.21%
1 Jan 1996 Jahr
15.86
+15.703
10.0 Tsnd.%
1 Jan 1997 Jahr
13.284
-2.575
-16.24%
1 Jan 1998 Jahr
20.353
+7.069
53.21%
1 Jan 1999 Jahr
12.778
-7.575
-37.22%
1 Jan 2000 Jahr
16.274
+3.497
27.36%
1 Jan 2001 Jahr
9.309
-6.965
-42.8%
1 Jan 2002 Jahr
6.809
-2.5
-26.86%
1 Jan 2003 Jahr
4.635
-2.174
-31.93%
1 Jan 2004 Jahr
13.268
+8.633
186.25%
1 Jan 2005 Jahr
17.585
+4.317
32.54%
1 Jan 2006 Jahr
23.804
+6.219
35.37%
1 Jan 2007 Jahr
23.943
+0.139
0.58%
1 Jan 2008 Jahr
22.213
-1.73
-7.23%
1 Jan 2009 Jahr
10.881
-11.332
-51.02%
1 Jan 2010 Jahr
7.612
-3.268
-30.04%
1 Jan 2011 Jahr
5.011
-2.602
-34.18%
1 Jan 2012 Jahr
7.276
+2.265
45.2%
1 Jan 2013 Jahr
9.854
+2.578
35.44%
1 Jan 2014 Jahr
13.228
+3.374
34.24%
1 Jan 2015 Jahr
9.105
-4.123
-31.17%
Bewertung der Länder gemäß mit laufender Statistik nach Jahren


Kommentare: