29
/de/
de
AIzaSyAYiBZKx7MnpbEhh9jyipgxe19OcubqV5w
April 1, 2024
245165
South Africa
ZAF
true
2
1
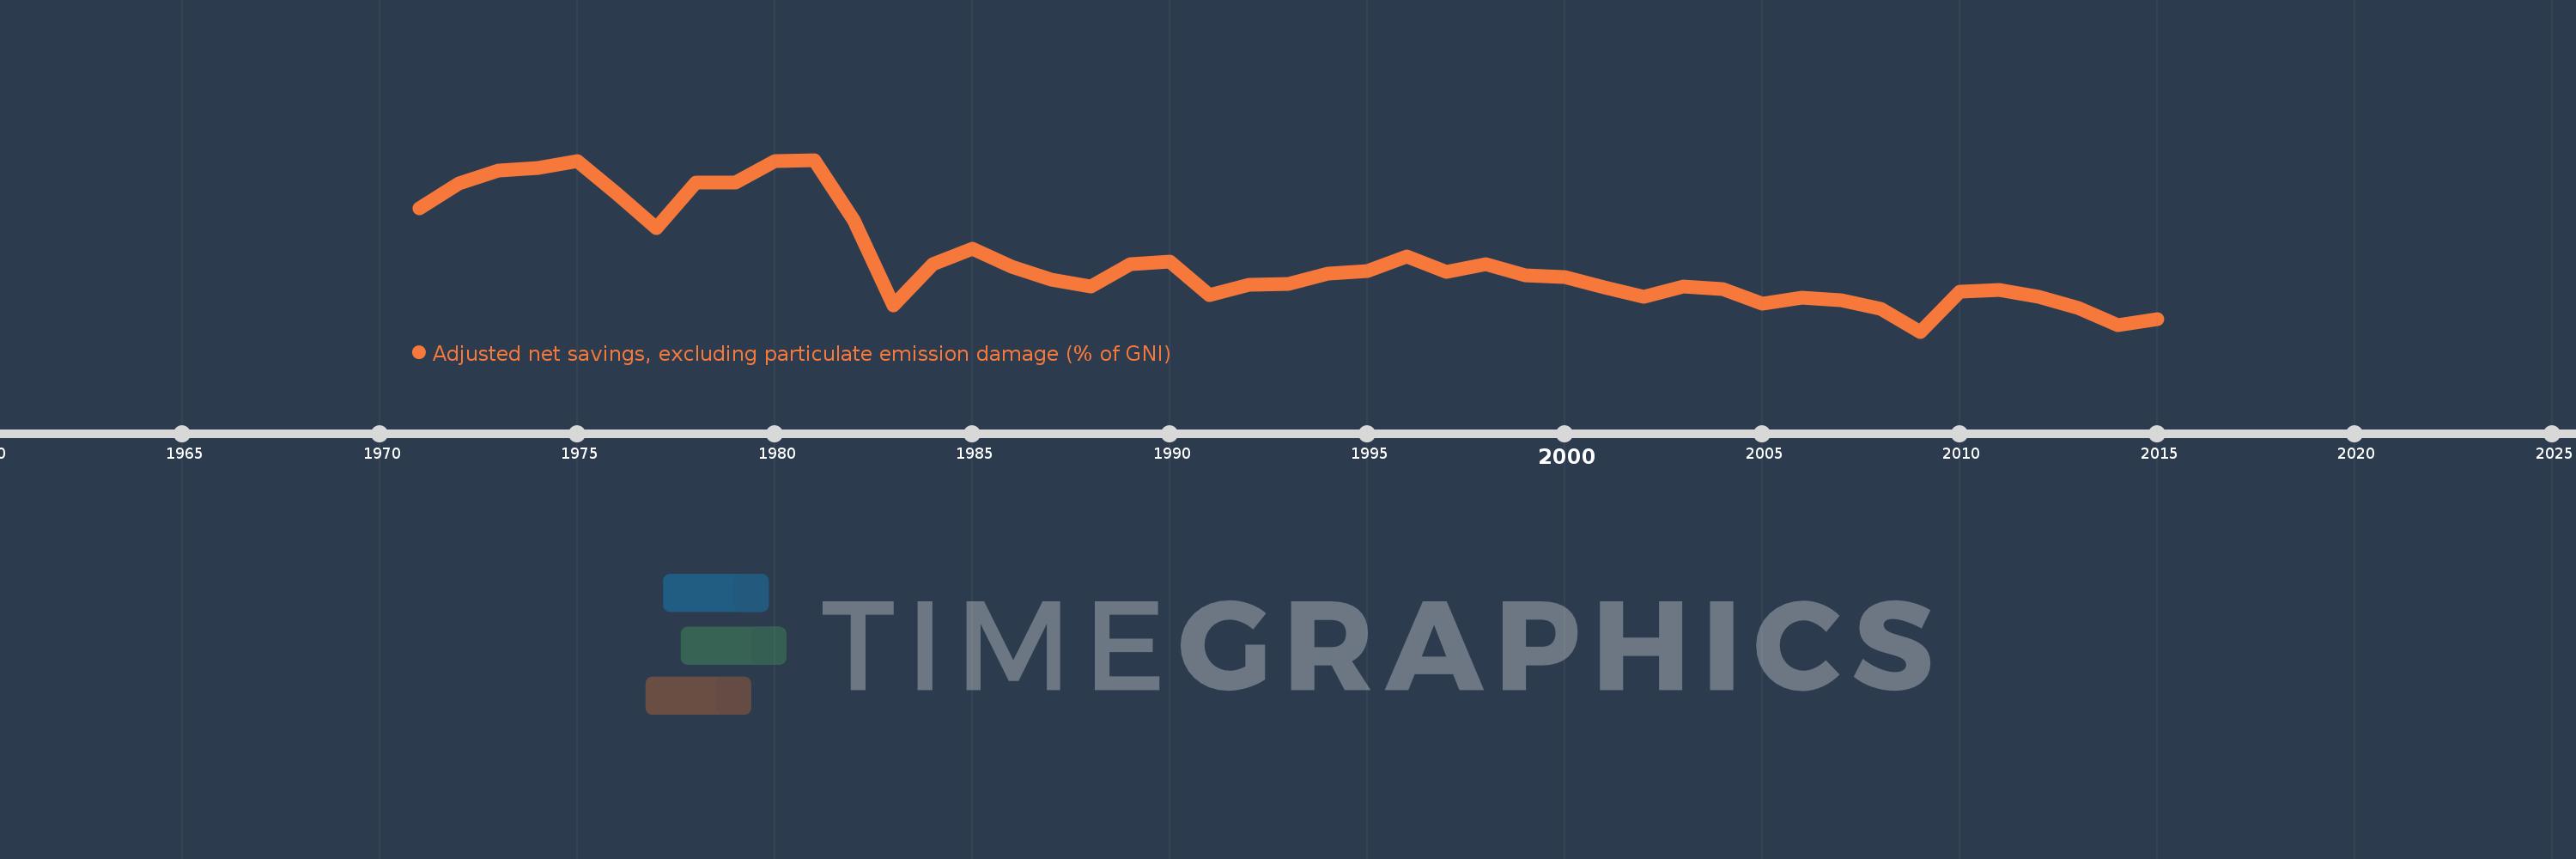
Adjusted net savings, excluding particulate emission damage (% of GNI)
2015,2014,2013,2012,2011,2010,2009,2008,2007,2006,2005,2004,2003,2002,2001,2000,1999,1998,1997,1996,1995,1994,1993,1992,1991,1990,1989,1988,1987,1986,1985,1984,1983,1982,1981,1980,1979,1978,1977,1976,1975,1974,1973,1972,1971
Diese Statistik in anderen Ländern:
AfghanistanAlbaniaAlgeriaAngolaArab WorldArgentinaArmeniaAustraliaAustriaAzerbaijanBahamas, TheBahrainBangladeshBarbadosBelarusBelgiumBelizeBeninBhutanBoliviaBotswanaBrazilBrunei DarussalamBulgariaBurkina FasoBurundiCabo VerdeCambodiaCameroonCanadaCaribbean small statesCentral African RepublicCentral Europe and the BalticsChadChileChinaColombiaComorosCongo, Dem. Rep.Congo, Rep.Costa RicaCote d'IvoireCroatiaCyprusCzech RepublicDenmarkDjiboutiDominicaDominican RepublicEarly-demographic dividendEast Asia & PacificEast Asia & Pacific (excluding high income)East Asia & Pacific (IDA & IBRD countries)EcuadorEgypt, Arab Rep.El SalvadorEquatorial GuineaEritreaEstoniaEthiopiaEuro areaEurope & Central AsiaEurope & Central Asia (excluding high income)Europe & Central Asia (IDA & IBRD countries)European UnionFijiFinlandFragile and conflict affected situationsFranceGabonGambia, TheGeorgiaGermanyGhanaGreeceGuatemalaGuineaGuinea-BissauGuyanaHaitiHeavily indebted poor countries (HIPC)High incomeHondurasHungaryIBRD onlyIcelandIDA & IBRD totalIDA blendIDA onlyIDA totalIndiaIndonesiaIran, Islamic Rep.IraqIrelandIsraelItalyJamaicaJapanJordanKazakhstanKenyaKiribatiKorea, Rep.KuwaitKyrgyz RepublicLao PDRLate-demographic dividendLatin America & Caribbean Latin America & Caribbean (excluding high income)Latin America & the Caribbean (IDA & IBRD countries)LatviaLeast developed countries: UN classificationLebanonLesothoLiberiaLibyaLithuaniaLow & middle incomeLow incomeLower middle incomeLuxembourgMacedonia, FYRMadagascarMalawiMalaysiaMaldivesMaliMauritaniaMauritiusMexicoMiddle East & North AfricaMiddle East & North Africa (excluding high income)Middle East & North Africa (IDA & IBRD countries)Middle incomeMoldovaMongoliaMoroccoMozambiqueNamibiaNepalNetherlandsNew ZealandNicaraguaNigerNigeriaNorth AmericaNorwayOECD membersOmanOther small statesPacific island small statesPakistanPanamaPapua New GuineaParaguayPeruPhilippinesPolandPortugalPost-demographic dividendPre-demographic dividendQatarRomaniaRussian FederationRwandaSaudi ArabiaSenegalSeychellesSierra LeoneSingaporeSlovak RepublicSloveniaSmall statesSolomon IslandsSouth AfricaSouth AsiaSouth Asia (IDA & IBRD)SpainSri LankaSt. LuciaSt. Vincent and the GrenadinesSub-Saharan Africa Sub-Saharan Africa (excluding high income)Sub-Saharan Africa (IDA & IBRD countries)SudanSurinameSwazilandSwedenSwitzerlandSyrian Arab RepublicTajikistanTanzaniaThailandTogoTongaTrinidad and TobagoTunisiaTurkeyUgandaUkraineUnited KingdomUnited StatesUpper middle incomeUruguayVanuatuVenezuela, RBVietnamWorldYemen, Rep.ZambiaZimbabwe Zeitlinie:
Diese Zeitleiste vorliegt die Graphik ab 1971 J. bis 2015 J. South Africa. Die Angaben bis 1970 J. sind nicht vorhanden. Die Zahl aktueller Beobachtungen nach Daten: 45.
Die Quelle (Bezeichnung):
Kennzahlen der Weltentwicklung
Die Quelle (Einrichtung):
World Bank staff estimates based on sources and methods in World Bank's "The Changing Wealth of Nations: Measuring Sustainable Development in the New Millennium" (2011).
Kategorien:
Economy & Growth, Environment
Es wurde aktualisiert:
23 Apr 2017 Jahr
Kennzahlen der Wertänderungen vom Jahr zum Jahr
Minimum:
1.37
1 Jan 2009 Jahr
Maximum:
17.382
1 Jan 1981 Jahr
Zum Datum der Beobachtung
Wert
Absolute Veränderung
Die Veränderung bezüglich dem vorherigen Wert
1 Jan 1971 Jahr
12.876
+12.876
0.0%
1 Jan 1972 Jahr
15.208
+2.332
18.11%
1 Jan 1973 Jahr
16.4
+1.192
7.84%
1 Jan 1974 Jahr
16.619
+0.219
1.34%
1 Jan 1975 Jahr
17.265
+0.646
3.89%
1 Jan 1976 Jahr
14.236
-3.029
-17.55%
1 Jan 1977 Jahr
11.022
-3.214
-22.58%
1 Jan 1978 Jahr
15.257
+4.235
38.43%
1 Jan 1979 Jahr
15.255
-0.002
-0.01%
1 Jan 1980 Jahr
17.249
+1.994
13.07%
1 Jan 1981 Jahr
17.382
+0.133
0.77%
1 Jan 1982 Jahr
11.763
-5.619
-32.33%
1 Jan 1983 Jahr
3.787
-7.976
-67.81%
1 Jan 1984 Jahr
7.627
+3.84
101.39%
1 Jan 1985 Jahr
9.079
+1.453
19.05%
1 Jan 1986 Jahr
7.449
-1.63
-17.95%
1 Jan 1987 Jahr
6.222
-1.227
-16.47%
1 Jan 1988 Jahr
5.551
-0.671
-10.78%
1 Jan 1989 Jahr
7.636
+2.085
37.56%
1 Jan 1990 Jahr
7.884
+0.248
3.24%
1 Jan 1991 Jahr
4.764
-3.12
-39.58%
1 Jan 1992 Jahr
5.747
+0.983
20.64%
1 Jan 1993 Jahr
5.81
+0.063
1.1%
1 Jan 1994 Jahr
6.814
+1.005
17.29%
1 Jan 1995 Jahr
7.023
+0.209
3.07%
1 Jan 1996 Jahr
8.369
+1.346
19.16%
1 Jan 1997 Jahr
6.927
-1.442
-17.23%
1 Jan 1998 Jahr
7.629
+0.702
10.13%
1 Jan 1999 Jahr
6.587
-1.042
-13.65%
1 Jan 2000 Jahr
6.428
-0.159
-2.41%
1 Jan 2001 Jahr
5.495
-0.933
-14.51%
1 Jan 2002 Jahr
4.587
-0.908
-16.52%
1 Jan 2003 Jahr
5.609
+1.021
22.27%
1 Jan 2004 Jahr
5.354
-0.255
-4.54%
1 Jan 2005 Jahr
3.983
-1.371
-25.61%
1 Jan 2006 Jahr
4.499
+0.516
12.95%
1 Jan 2007 Jahr
4.314
-0.185
-4.11%
1 Jan 2008 Jahr
3.498
-0.816
-18.92%
1 Jan 2009 Jahr
1.37
-2.128
-60.84%
1 Jan 2010 Jahr
5.059
+3.689
269.38%
1 Jan 2011 Jahr
5.259
+0.2
3.95%
1 Jan 2012 Jahr
4.642
-0.617
-11.73%
1 Jan 2013 Jahr
3.592
-1.049
-22.6%
1 Jan 2014 Jahr
1.945
-1.647
-45.85%
1 Jan 2015 Jahr
2.509
+0.564
28.97%
Bewertung der Länder gemäß mit laufender Statistik nach Jahren


Kommentare: