29
/de/
de
AIzaSyAYiBZKx7MnpbEhh9jyipgxe19OcubqV5w
April 1, 2024
257958
Syrian Arab Republic
SYR
true
2
1
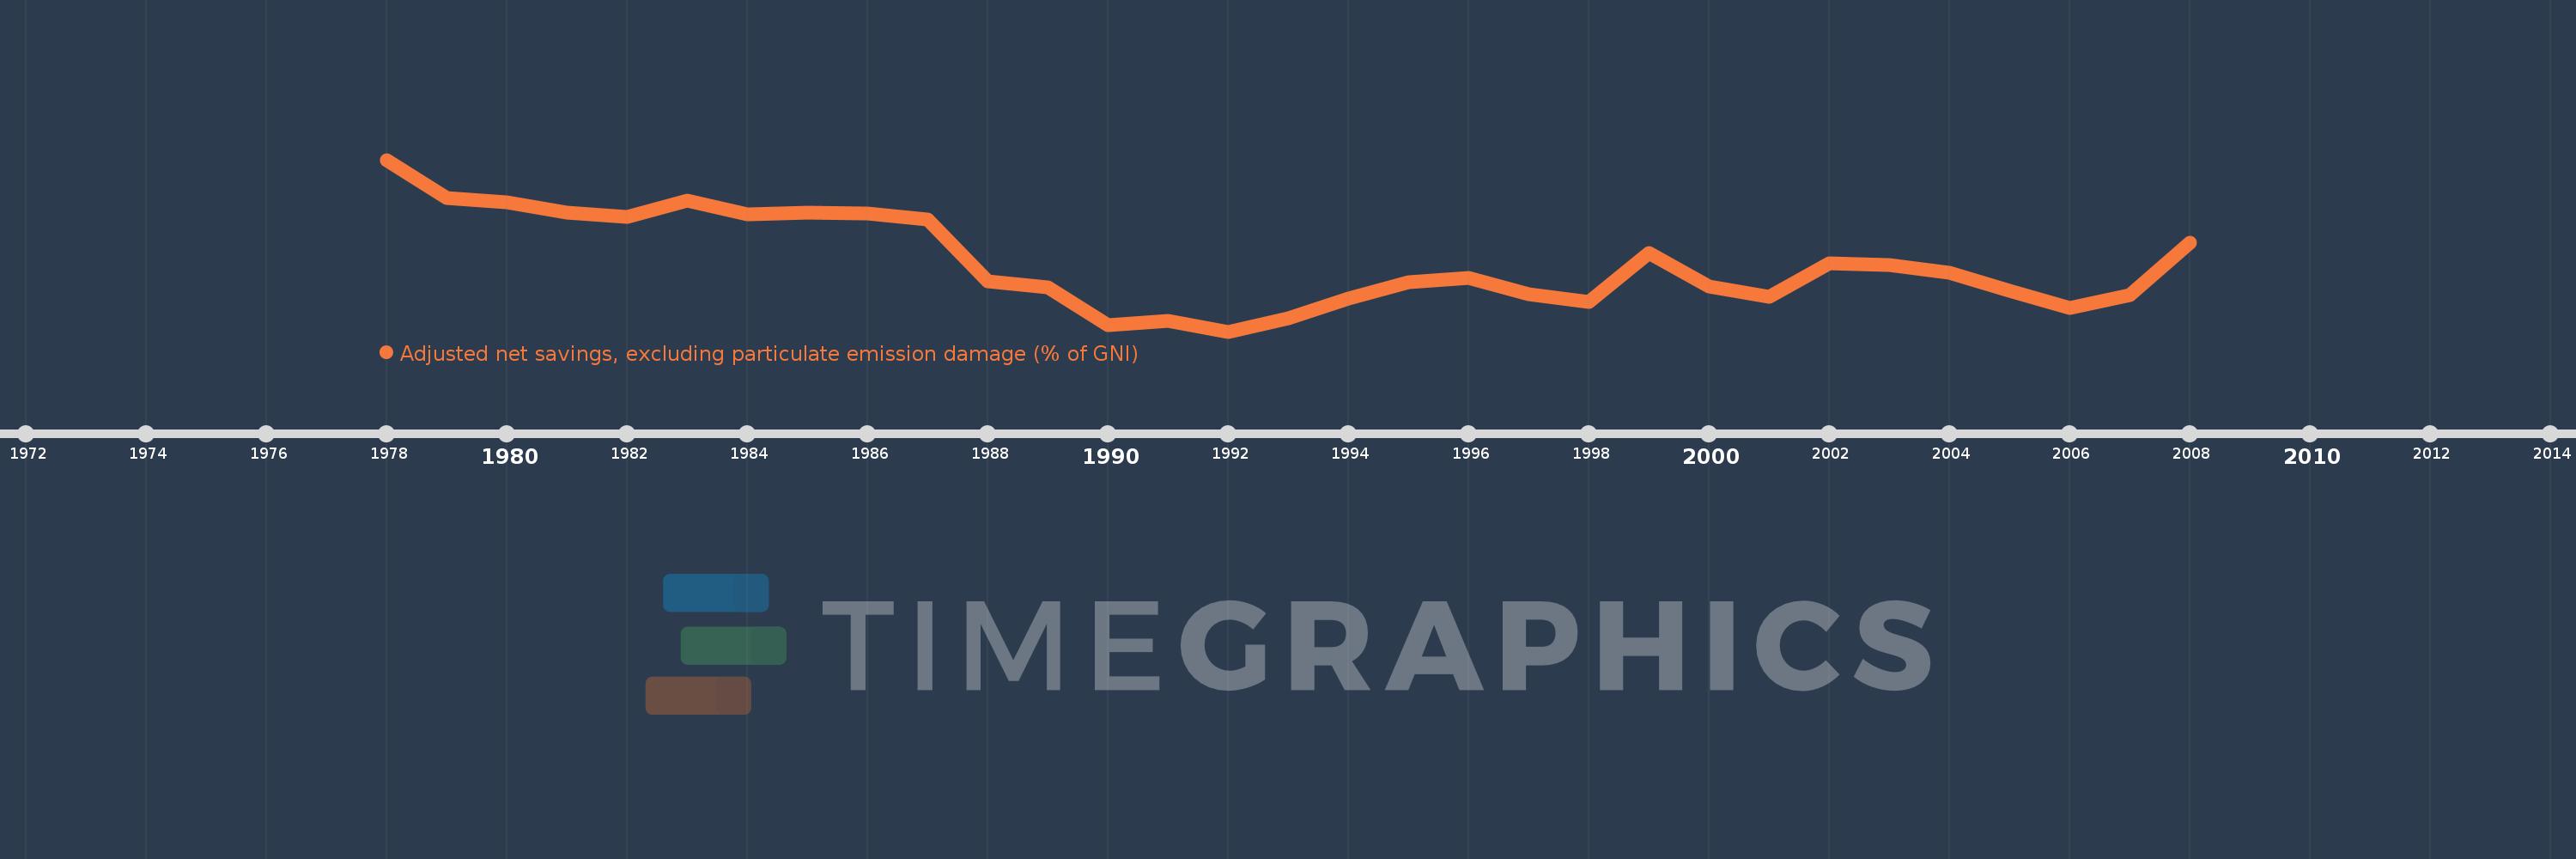
Adjusted net savings, excluding particulate emission damage (% of GNI)
2008,2007,2006,2005,2004,2003,2002,2001,2000,1999,1998,1997,1996,1995,1994,1993,1992,1991,1990,1989,1988,1987,1986,1985,1984,1983,1982,1981,1980,1979,1978
Diese Statistik in anderen Ländern:
AfghanistanAlbaniaAlgeriaAngolaArab WorldArgentinaArmeniaAustraliaAustriaAzerbaijanBahamas, TheBahrainBangladeshBarbadosBelarusBelgiumBelizeBeninBhutanBoliviaBotswanaBrazilBrunei DarussalamBulgariaBurkina FasoBurundiCabo VerdeCambodiaCameroonCanadaCaribbean small statesCentral African RepublicCentral Europe and the BalticsChadChileChinaColombiaComorosCongo, Dem. Rep.Congo, Rep.Costa RicaCote d'IvoireCroatiaCyprusCzech RepublicDenmarkDjiboutiDominicaDominican RepublicEarly-demographic dividendEast Asia & PacificEast Asia & Pacific (excluding high income)East Asia & Pacific (IDA & IBRD countries)EcuadorEgypt, Arab Rep.El SalvadorEquatorial GuineaEritreaEstoniaEthiopiaEuro areaEurope & Central AsiaEurope & Central Asia (excluding high income)Europe & Central Asia (IDA & IBRD countries)European UnionFijiFinlandFragile and conflict affected situationsFranceGabonGambia, TheGeorgiaGermanyGhanaGreeceGuatemalaGuineaGuinea-BissauGuyanaHaitiHeavily indebted poor countries (HIPC)High incomeHondurasHungaryIBRD onlyIcelandIDA & IBRD totalIDA blendIDA onlyIDA totalIndiaIndonesiaIran, Islamic Rep.IraqIrelandIsraelItalyJamaicaJapanJordanKazakhstanKenyaKiribatiKorea, Rep.KuwaitKyrgyz RepublicLao PDRLate-demographic dividendLatin America & Caribbean Latin America & Caribbean (excluding high income)Latin America & the Caribbean (IDA & IBRD countries)LatviaLeast developed countries: UN classificationLebanonLesothoLiberiaLibyaLithuaniaLow & middle incomeLow incomeLower middle incomeLuxembourgMacedonia, FYRMadagascarMalawiMalaysiaMaldivesMaliMauritaniaMauritiusMexicoMiddle East & North AfricaMiddle East & North Africa (excluding high income)Middle East & North Africa (IDA & IBRD countries)Middle incomeMoldovaMongoliaMoroccoMozambiqueNamibiaNepalNetherlandsNew ZealandNicaraguaNigerNigeriaNorth AmericaNorwayOECD membersOmanOther small statesPacific island small statesPakistanPanamaPapua New GuineaParaguayPeruPhilippinesPolandPortugalPost-demographic dividendPre-demographic dividendQatarRomaniaRussian FederationRwandaSaudi ArabiaSenegalSeychellesSierra LeoneSingaporeSlovak RepublicSloveniaSmall statesSolomon IslandsSouth AfricaSouth AsiaSouth Asia (IDA & IBRD)SpainSri LankaSt. LuciaSt. Vincent and the GrenadinesSub-Saharan Africa Sub-Saharan Africa (excluding high income)Sub-Saharan Africa (IDA & IBRD countries)SudanSurinameSwazilandSwedenSwitzerlandSyrian Arab RepublicTajikistanTanzaniaThailandTogoTongaTrinidad and TobagoTunisiaTurkeyUgandaUkraineUnited KingdomUnited StatesUpper middle incomeUruguayVanuatuVenezuela, RBVietnamWorldYemen, Rep.ZambiaZimbabwe Zeitlinie:
Diese Zeitleiste vorliegt die Graphik ab 1978 J. bis 2008 J. Syrian Arab Republic. Die Angaben bis 1977 J. sind nicht vorhanden. Die Zahl aktueller Beobachtungen nach Daten: 31.
Die Quelle (Bezeichnung):
Kennzahlen der Weltentwicklung
Die Quelle (Einrichtung):
World Bank staff estimates based on sources and methods in World Bank's "The Changing Wealth of Nations: Measuring Sustainable Development in the New Millennium" (2011).
Kategorien:
Economy & Growth, Environment
Es wurde aktualisiert:
23 Apr 2017 Jahr
Kennzahlen der Wertänderungen vom Jahr zum Jahr
Minimum:
-11.709
1 Jan 1992 Jahr
Maximum:
29.26
1 Jan 1978 Jahr
Zum Datum der Beobachtung
Wert
Absolute Veränderung
Die Veränderung bezüglich dem vorherigen Wert
1 Jan 1978 Jahr
29.26
+29.26
0.0%
1 Jan 1979 Jahr
20.23
-9.03
-30.86%
1 Jan 1980 Jahr
19.072
-1.158
-5.72%
1 Jan 1981 Jahr
16.619
-2.453
-12.86%
1 Jan 1982 Jahr
15.539
-1.08
-6.5%
1 Jan 1983 Jahr
19.537
+3.997
25.72%
1 Jan 1984 Jahr
16.263
-3.273
-16.76%
1 Jan 1985 Jahr
16.638
+0.375
2.31%
1 Jan 1986 Jahr
16.472
-0.166
-1.0%
1 Jan 1987 Jahr
15.12
-1.352
-8.21%
1 Jan 1988 Jahr
0.374
-14.746
-97.53%
1 Jan 1989 Jahr
-1.083
-1.457
-389.53%
1 Jan 1990 Jahr
-10.135
-9.052
835.7%
1 Jan 1991 Jahr
-9.177
+0.958
-9.45%
1 Jan 1992 Jahr
-11.709
-2.532
27.59%
1 Jan 1993 Jahr
-8.613
+3.097
-26.45%
1 Jan 1994 Jahr
-3.721
+4.892
-56.8%
1 Jan 1995 Jahr
0.143
+3.864
-103.86%
1 Jan 1996 Jahr
1.05
+0.907
632.19%
1 Jan 1997 Jahr
-2.729
-3.78
-359.87%
1 Jan 1998 Jahr
-4.681
-1.952
71.52%
1 Jan 1999 Jahr
7.075
+11.757
-251.14%
1 Jan 2000 Jahr
-1.044
-8.119
-114.76%
1 Jan 2001 Jahr
-3.437
-2.393
229.18%
1 Jan 2002 Jahr
4.569
+8.006
-232.95%
1 Jan 2003 Jahr
4.253
-0.316
-6.92%
1 Jan 2004 Jahr
2.305
-1.948
-45.8%
1 Jan 2005 Jahr
-1.976
-4.281
-185.72%
1 Jan 2006 Jahr
-6.068
-4.092
207.06%
1 Jan 2007 Jahr
-2.962
+3.106
-51.18%
1 Jan 2008 Jahr
9.561
+12.523
-422.77%
Bewertung der Länder gemäß mit laufender Statistik nach Jahren


Kommentare: