29
/de/
de
AIzaSyAYiBZKx7MnpbEhh9jyipgxe19OcubqV5w
April 1, 2024
95090
Burkina Faso
BFA
true
2
1
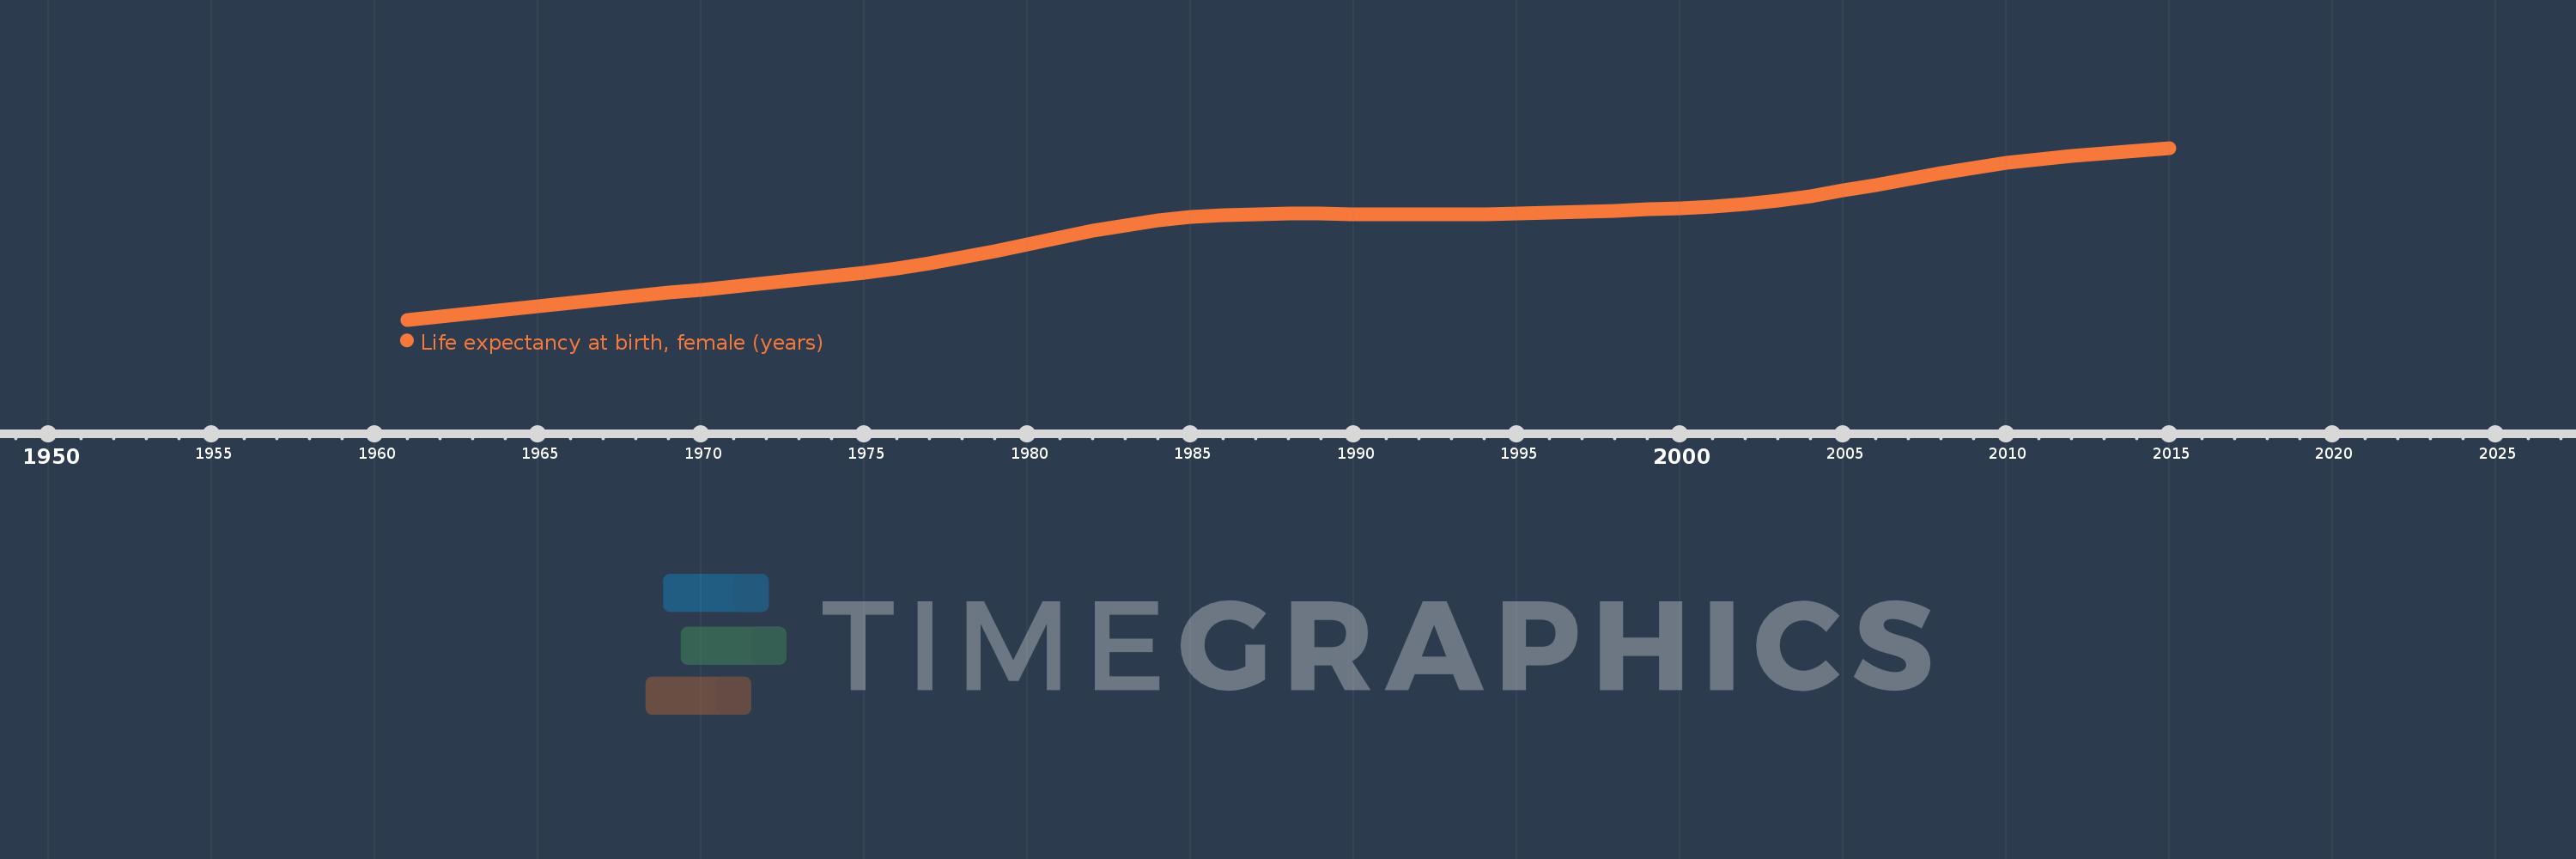
Life expectancy at birth, female (years)
2015,2014,2013,2012,2011,2010,2009,2008,2007,2006,2005,2004,2003,2002,2001,2000,1999,1998,1997,1996,1995,1994,1993,1992,1991,1990,1989,1988,1987,1986,1985,1984,1983,1982,1981,1980,1979,1978,1977,1976,1975,1974,1973,1972,1971,1970,1969,1968,1967,1966,1965,1964,1963,1962,1961
Diese Statistik in anderen Ländern:
AfghanistanAlbaniaAlgeriaAngolaAntigua and BarbudaArab WorldArgentinaArmeniaArubaAustraliaAustriaAzerbaijanBahamas, TheBahrainBangladeshBarbadosBelarusBelgiumBelizeBeninBermudaBhutanBoliviaBosnia and HerzegovinaBotswanaBrazilBrunei DarussalamBulgariaBurkina FasoBurundiCabo VerdeCambodiaCameroonCanadaCaribbean small statesCentral African RepublicCentral Europe and the BalticsChadChannel IslandsChileChinaColombiaComorosCongo, Dem. Rep.Congo, Rep.Costa RicaCote d'IvoireCroatiaCubaCuracaoCyprusCzech RepublicDenmarkDjiboutiDominicaDominican RepublicEarly-demographic dividendEast Asia & PacificEast Asia & Pacific (excluding high income)East Asia & Pacific (IDA & IBRD countries)EcuadorEgypt, Arab Rep.El SalvadorEquatorial GuineaEritreaEstoniaEthiopiaEuro areaEurope & Central AsiaEurope & Central Asia (excluding high income)Europe & Central Asia (IDA & IBRD countries)European UnionFaroe IslandsFijiFinlandFragile and conflict affected situationsFranceFrench PolynesiaGabonGambia, TheGeorgiaGermanyGhanaGreeceGreenlandGrenadaGuamGuatemalaGuineaGuinea-BissauGuyanaHaitiHeavily indebted poor countries (HIPC)High incomeHondurasHong Kong SAR, ChinaHungaryIBRD onlyIcelandIDA & IBRD totalIDA blendIDA onlyIDA totalIndiaIndonesiaIran, Islamic Rep.IraqIrelandIsle of ManIsraelItalyJamaicaJapanJordanKazakhstanKenyaKiribatiKorea, Dem. People’s Rep.Korea, Rep.KosovoKuwaitKyrgyz RepublicLao PDRLate-demographic dividendLatin America & Caribbean Latin America & Caribbean (excluding high income)Latin America & the Caribbean (IDA & IBRD countries)LatviaLeast developed countries: UN classificationLebanonLesothoLiberiaLibyaLiechtensteinLithuaniaLow & middle incomeLow incomeLower middle incomeLuxembourgMacao SAR, ChinaMacedonia, FYRMadagascarMalawiMalaysiaMaldivesMaliMaltaMarshall IslandsMauritaniaMauritiusMexicoMicronesia, Fed. Sts.Middle East & North AfricaMiddle East & North Africa (excluding high income)Middle East & North Africa (IDA & IBRD countries)Middle incomeMoldovaMongoliaMontenegroMoroccoMozambiqueMyanmarNamibiaNepalNetherlandsNew CaledoniaNew ZealandNicaraguaNigerNigeriaNorth AmericaNorwayOECD membersOmanOther small statesPacific island small statesPakistanPalauPanamaPapua New GuineaParaguayPeruPhilippinesPolandPortugalPost-demographic dividendPre-demographic dividendPuerto RicoQatarRomaniaRussian FederationRwandaSamoaSan MarinoSao Tome and PrincipeSaudi ArabiaSenegalSerbiaSeychellesSierra LeoneSingaporeSint Maarten (Dutch part)Slovak RepublicSloveniaSmall statesSolomon IslandsSomaliaSouth AfricaSouth AsiaSouth Asia (IDA & IBRD)South SudanSpainSri LankaSt. Kitts and NevisSt. LuciaSt. Martin (French part)St. Vincent and the GrenadinesSub-Saharan Africa Sub-Saharan Africa (excluding high income)Sub-Saharan Africa (IDA & IBRD countries)SudanSurinameSwazilandSwedenSwitzerlandSyrian Arab RepublicTajikistanTanzaniaThailandTimor-LesteTogoTongaTrinidad and TobagoTunisiaTurkeyTurkmenistanUgandaUkraineUnited Arab EmiratesUnited KingdomUnited StatesUpper middle incomeUruguayUzbekistanVanuatuVenezuela, RBVietnamVirgin Islands (U.S.)West Bank and GazaWorldYemen, Rep.ZambiaZimbabwe Zeitlinie:
Diese Zeitleiste vorliegt die Graphik ab 1961 J. bis 2015 J. Burkina Faso. Die Angaben bis 1960 J. sind nicht vorhanden. Die Zahl aktueller Beobachtungen nach Daten: 55.
Die Quelle (Bezeichnung):
Kennzahlen der Weltentwicklung
Die Quelle (Einrichtung):
(1) United Nations Population Division. World Population Prospects, (2) Census reports and other statistical publications from national statistical offices, (3) Eurostat: Demographic Statistics, (4) United Nations Statistical Division. Population and Vital Statistics Reprot (various years), (5) U.S. Census Bureau: International Database, and (6) Secretariat of the Pacific Community: Statistics and Demography Programme.
Kategorien:
Health, Gender, Social Development
Es wurde aktualisiert:
23 Apr 2017 Jahr
Kennzahlen der Wertänderungen vom Jahr zum Jahr
Minimum:
35.553
1 Jan 1961 Jahr
Maximum:
59.934
1 Jan 2015 Jahr
Zum Datum der Beobachtung
Wert
Absolute Veränderung
Die Veränderung bezüglich dem vorherigen Wert
1 Jan 1961 Jahr
35.553
+35.553
0.0%
1 Jan 1962 Jahr
36.025
+0.472
1.33%
1 Jan 1963 Jahr
36.503
+0.478
1.33%
1 Jan 1964 Jahr
36.986
+0.483
1.32%
1 Jan 1965 Jahr
37.474
+0.488
1.32%
1 Jan 1966 Jahr
37.961
+0.487
1.3%
1 Jan 1967 Jahr
38.441
+0.48
1.26%
1 Jan 1968 Jahr
38.91
+0.469
1.22%
1 Jan 1969 Jahr
39.37
+0.46
1.18%
1 Jan 1970 Jahr
39.824
+0.454
1.15%
1 Jan 1971 Jahr
40.278
+0.454
1.14%
1 Jan 1972 Jahr
40.735
+0.457
1.13%
1 Jan 1973 Jahr
41.206
+0.471
1.16%
1 Jan 1974 Jahr
41.705
+0.499
1.21%
1 Jan 1975 Jahr
42.242
+0.537
1.29%
1 Jan 1976 Jahr
42.85
+0.608
1.44%
1 Jan 1977 Jahr
43.561
+0.711
1.66%
1 Jan 1978 Jahr
44.38
+0.819
1.88%
1 Jan 1979 Jahr
45.288
+0.908
2.05%
1 Jan 1980 Jahr
46.257
+0.969
2.14%
1 Jan 1981 Jahr
47.234
+0.977
2.11%
1 Jan 1982 Jahr
48.154
+0.92
1.95%
1 Jan 1983 Jahr
48.962
+0.808
1.68%
1 Jan 1984 Jahr
49.619
+0.657
1.34%
1 Jan 1985 Jahr
50.106
+0.487
0.98%
1 Jan 1986 Jahr
50.418
+0.312
0.62%
1 Jan 1987 Jahr
50.571
+0.153
0.3%
1 Jan 1988 Jahr
50.616
+0.045
0.09%
1 Jan 1989 Jahr
50.601
-0.015
-0.03%
1 Jan 1990 Jahr
50.559
-0.042
-0.08%
1 Jan 1991 Jahr
50.516
-0.043
-0.09%
1 Jan 1992 Jahr
50.494
-0.022
-0.04%
1 Jan 1993 Jahr
50.498
+0.004
0.01%
1 Jan 1994 Jahr
50.534
+0.036
0.07%
1 Jan 1995 Jahr
50.613
+0.079
0.16%
1 Jan 1996 Jahr
50.73
+0.117
0.23%
1 Jan 1997 Jahr
50.871
+0.141
0.28%
1 Jan 1998 Jahr
51.023
+0.152
0.3%
1 Jan 1999 Jahr
51.187
+0.164
0.32%
1 Jan 2000 Jahr
51.377
+0.19
0.37%
1 Jan 2001 Jahr
51.63
+0.253
0.49%
1 Jan 2002 Jahr
51.992
+0.362
0.7%
1 Jan 2003 Jahr
52.487
+0.495
0.95%
1 Jan 2004 Jahr
53.118
+0.631
1.2%
1 Jan 2005 Jahr
53.869
+0.751
1.41%
1 Jan 2006 Jahr
54.702
+0.833
1.55%
1 Jan 2007 Jahr
55.563
+0.861
1.57%
1 Jan 2008 Jahr
56.394
+0.831
1.5%
1 Jan 2009 Jahr
57.15
+0.756
1.34%
1 Jan 2010 Jahr
57.807
+0.657
1.15%
1 Jan 2011 Jahr
58.358
+0.551
0.95%
1 Jan 2012 Jahr
58.813
+0.455
0.78%
1 Jan 2013 Jahr
59.21
+0.397
0.68%
1 Jan 2014 Jahr
59.579
+0.369
0.62%
1 Jan 2015 Jahr
59.934
+0.355
0.6%
Bewertung der Länder gemäß mit laufender Statistik nach Jahren


Kommentare: