29
/de/
de
AIzaSyAYiBZKx7MnpbEhh9jyipgxe19OcubqV5w
April 1, 2024
24244
Arab World
ARB
false
2
1
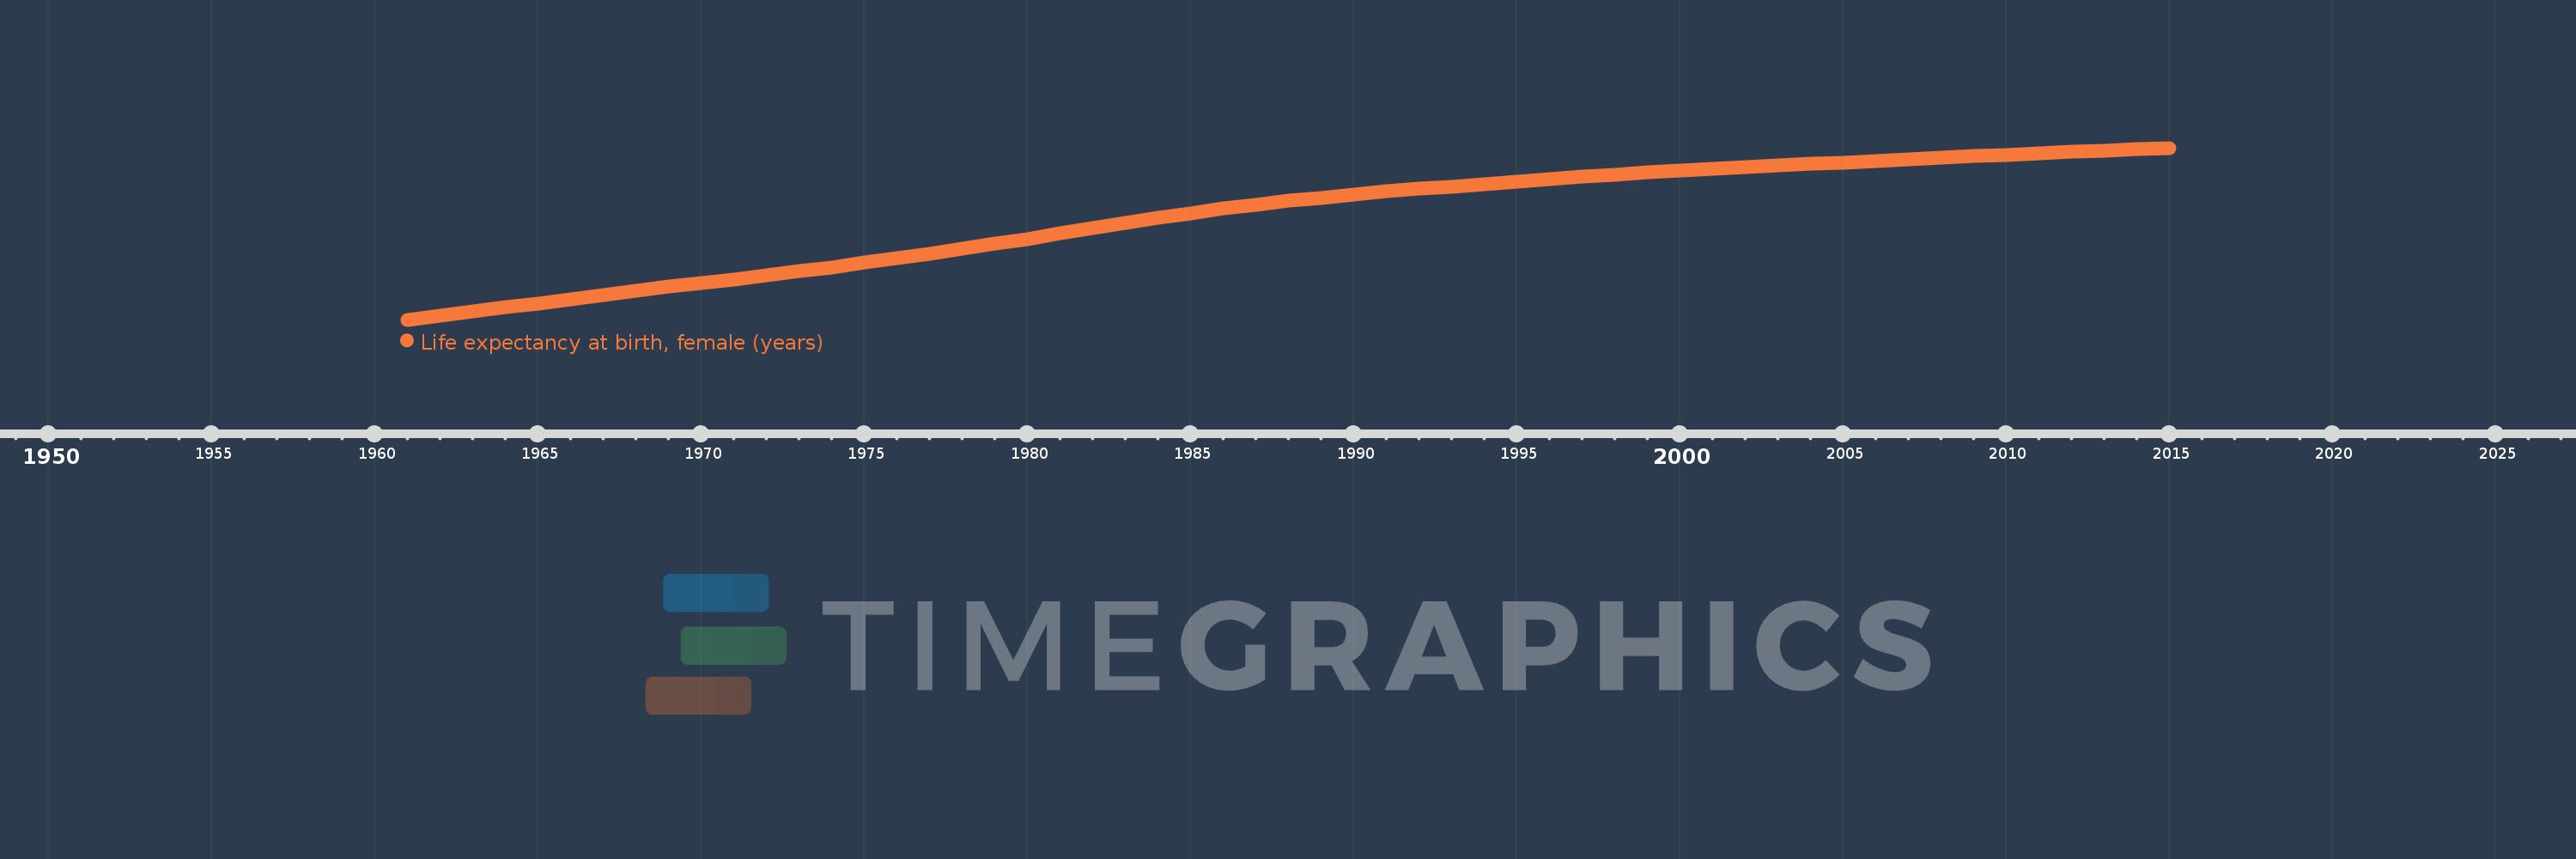
Life expectancy at birth, female (years)
2015,2014,2013,2012,2011,2010,2009,2008,2007,2006,2005,2004,2003,2002,2001,2000,1999,1998,1997,1996,1995,1994,1993,1992,1991,1990,1989,1988,1987,1986,1985,1984,1983,1982,1981,1980,1979,1978,1977,1976,1975,1974,1973,1972,1971,1970,1969,1968,1967,1966,1965,1964,1963,1962,1961
Diese Statistik in anderen Ländern:
AfghanistanAlbaniaAlgeriaAngolaAntigua and BarbudaArab WorldArgentinaArmeniaArubaAustraliaAustriaAzerbaijanBahamas, TheBahrainBangladeshBarbadosBelarusBelgiumBelizeBeninBermudaBhutanBoliviaBosnia and HerzegovinaBotswanaBrazilBrunei DarussalamBulgariaBurkina FasoBurundiCabo VerdeCambodiaCameroonCanadaCaribbean small statesCentral African RepublicCentral Europe and the BalticsChadChannel IslandsChileChinaColombiaComorosCongo, Dem. Rep.Congo, Rep.Costa RicaCote d'IvoireCroatiaCubaCuracaoCyprusCzech RepublicDenmarkDjiboutiDominicaDominican RepublicEarly-demographic dividendEast Asia & PacificEast Asia & Pacific (excluding high income)East Asia & Pacific (IDA & IBRD countries)EcuadorEgypt, Arab Rep.El SalvadorEquatorial GuineaEritreaEstoniaEthiopiaEuro areaEurope & Central AsiaEurope & Central Asia (excluding high income)Europe & Central Asia (IDA & IBRD countries)European UnionFaroe IslandsFijiFinlandFragile and conflict affected situationsFranceFrench PolynesiaGabonGambia, TheGeorgiaGermanyGhanaGreeceGreenlandGrenadaGuamGuatemalaGuineaGuinea-BissauGuyanaHaitiHeavily indebted poor countries (HIPC)High incomeHondurasHong Kong SAR, ChinaHungaryIBRD onlyIcelandIDA & IBRD totalIDA blendIDA onlyIDA totalIndiaIndonesiaIran, Islamic Rep.IraqIrelandIsle of ManIsraelItalyJamaicaJapanJordanKazakhstanKenyaKiribatiKorea, Dem. People’s Rep.Korea, Rep.KosovoKuwaitKyrgyz RepublicLao PDRLate-demographic dividendLatin America & Caribbean Latin America & Caribbean (excluding high income)Latin America & the Caribbean (IDA & IBRD countries)LatviaLeast developed countries: UN classificationLebanonLesothoLiberiaLibyaLiechtensteinLithuaniaLow & middle incomeLow incomeLower middle incomeLuxembourgMacao SAR, ChinaMacedonia, FYRMadagascarMalawiMalaysiaMaldivesMaliMaltaMarshall IslandsMauritaniaMauritiusMexicoMicronesia, Fed. Sts.Middle East & North AfricaMiddle East & North Africa (excluding high income)Middle East & North Africa (IDA & IBRD countries)Middle incomeMoldovaMongoliaMontenegroMoroccoMozambiqueMyanmarNamibiaNepalNetherlandsNew CaledoniaNew ZealandNicaraguaNigerNigeriaNorth AmericaNorwayOECD membersOmanOther small statesPacific island small statesPakistanPalauPanamaPapua New GuineaParaguayPeruPhilippinesPolandPortugalPost-demographic dividendPre-demographic dividendPuerto RicoQatarRomaniaRussian FederationRwandaSamoaSan MarinoSao Tome and PrincipeSaudi ArabiaSenegalSerbiaSeychellesSierra LeoneSingaporeSint Maarten (Dutch part)Slovak RepublicSloveniaSmall statesSolomon IslandsSomaliaSouth AfricaSouth AsiaSouth Asia (IDA & IBRD)South SudanSpainSri LankaSt. Kitts and NevisSt. LuciaSt. Martin (French part)St. Vincent and the GrenadinesSub-Saharan Africa Sub-Saharan Africa (excluding high income)Sub-Saharan Africa (IDA & IBRD countries)SudanSurinameSwazilandSwedenSwitzerlandSyrian Arab RepublicTajikistanTanzaniaThailandTimor-LesteTogoTongaTrinidad and TobagoTunisiaTurkeyTurkmenistanUgandaUkraineUnited Arab EmiratesUnited KingdomUnited StatesUpper middle incomeUruguayUzbekistanVanuatuVenezuela, RBVietnamVirgin Islands (U.S.)West Bank and GazaWorldYemen, Rep.ZambiaZimbabwe Zeitlinie:
Diese Zeitleiste vorliegt die Graphik ab 1961 J. bis 2015 J. Arab World. Die Angaben bis 1960 J. sind nicht vorhanden. Die Zahl aktueller Beobachtungen nach Daten: 55.
Die Quelle (Bezeichnung):
Kennzahlen der Weltentwicklung
Die Quelle (Einrichtung):
(1) United Nations Population Division. World Population Prospects, (2) Census reports and other statistical publications from national statistical offices, (3) Eurostat: Demographic Statistics, (4) United Nations Statistical Division. Population and Vital Statistics Reprot (various years), (5) U.S. Census Bureau: International Database, and (6) Secretariat of the Pacific Community: Statistics and Demography Programme.
Kategorien:
Health, Gender, Social Development
Es wurde aktualisiert:
23 Apr 2017 Jahr
Kennzahlen der Wertänderungen vom Jahr zum Jahr
Minimum:
47.886
1 Jan 1961 Jahr
Maximum:
72.502
1 Jan 2015 Jahr
Zum Datum der Beobachtung
Wert
Absolute Veränderung
Die Veränderung bezüglich dem vorherigen Wert
1 Jan 1961 Jahr
47.886
+47.886
0.0%
1 Jan 1962 Jahr
48.463
+0.578
1.21%
1 Jan 1963 Jahr
49.044
+0.581
1.2%
1 Jan 1964 Jahr
49.634
+0.59
1.2%
1 Jan 1965 Jahr
50.234
+0.601
1.21%
1 Jan 1966 Jahr
50.84
+0.605
1.21%
1 Jan 1967 Jahr
51.439
+0.599
1.18%
1 Jan 1968 Jahr
52.024
+0.585
1.14%
1 Jan 1969 Jahr
52.591
+0.567
1.09%
1 Jan 1970 Jahr
53.144
+0.553
1.05%
1 Jan 1971 Jahr
53.692
+0.548
1.03%
1 Jan 1972 Jahr
54.247
+0.555
1.03%
1 Jan 1973 Jahr
54.821
+0.574
1.06%
1 Jan 1974 Jahr
55.418
+0.597
1.09%
1 Jan 1975 Jahr
56.036
+0.619
1.12%
1 Jan 1976 Jahr
56.679
+0.643
1.15%
1 Jan 1977 Jahr
57.347
+0.668
1.18%
1 Jan 1978 Jahr
58.037
+0.69
1.2%
1 Jan 1979 Jahr
58.747
+0.71
1.22%
1 Jan 1980 Jahr
59.478
+0.731
1.24%
1 Jan 1981 Jahr
60.227
+0.749
1.26%
1 Jan 1982 Jahr
60.986
+0.759
1.26%
1 Jan 1983 Jahr
61.74
+0.754
1.24%
1 Jan 1984 Jahr
62.474
+0.734
1.19%
1 Jan 1985 Jahr
63.169
+0.695
1.11%
1 Jan 1986 Jahr
63.811
+0.642
1.02%
1 Jan 1987 Jahr
64.391
+0.58
0.91%
1 Jan 1988 Jahr
64.914
+0.523
0.81%
1 Jan 1989 Jahr
65.385
+0.471
0.73%
1 Jan 1990 Jahr
65.81
+0.425
0.65%
1 Jan 1991 Jahr
66.276
+0.466
0.71%
1 Jan 1992 Jahr
66.628
+0.352
0.53%
1 Jan 1993 Jahr
66.925
+0.297
0.45%
1 Jan 1994 Jahr
67.269
+0.344
0.51%
1 Jan 1995 Jahr
67.623
+0.354
0.53%
1 Jan 1996 Jahr
68.016
+0.393
0.58%
1 Jan 1997 Jahr
68.359
+0.343
0.5%
1 Jan 1998 Jahr
68.693
+0.334
0.49%
1 Jan 1999 Jahr
68.996
+0.303
0.44%
1 Jan 2000 Jahr
69.283
+0.287
0.42%
1 Jan 2001 Jahr
69.531
+0.248
0.36%
1 Jan 2002 Jahr
69.765
+0.234
0.34%
1 Jan 2003 Jahr
69.981
+0.216
0.31%
1 Jan 2004 Jahr
70.19
+0.209
0.3%
1 Jan 2005 Jahr
70.407
+0.217
0.31%
1 Jan 2006 Jahr
70.629
+0.221
0.31%
1 Jan 2007 Jahr
70.863
+0.234
0.33%
1 Jan 2008 Jahr
71.087
+0.224
0.32%
1 Jan 2009 Jahr
71.303
+0.216
0.3%
1 Jan 2010 Jahr
71.516
+0.213
0.3%
1 Jan 2011 Jahr
71.719
+0.203
0.28%
1 Jan 2012 Jahr
71.918
+0.2
0.28%
1 Jan 2013 Jahr
72.102
+0.184
0.26%
1 Jan 2014 Jahr
72.302
+0.2
0.28%
1 Jan 2015 Jahr
72.502
+0.2
0.28%
Bewertung der Länder gemäß mit laufender Statistik nach Jahren


Kommentare: