29
/de/
de
AIzaSyAYiBZKx7MnpbEhh9jyipgxe19OcubqV5w
April 1, 2024
261132
Tanzania
TZA
true
2
1
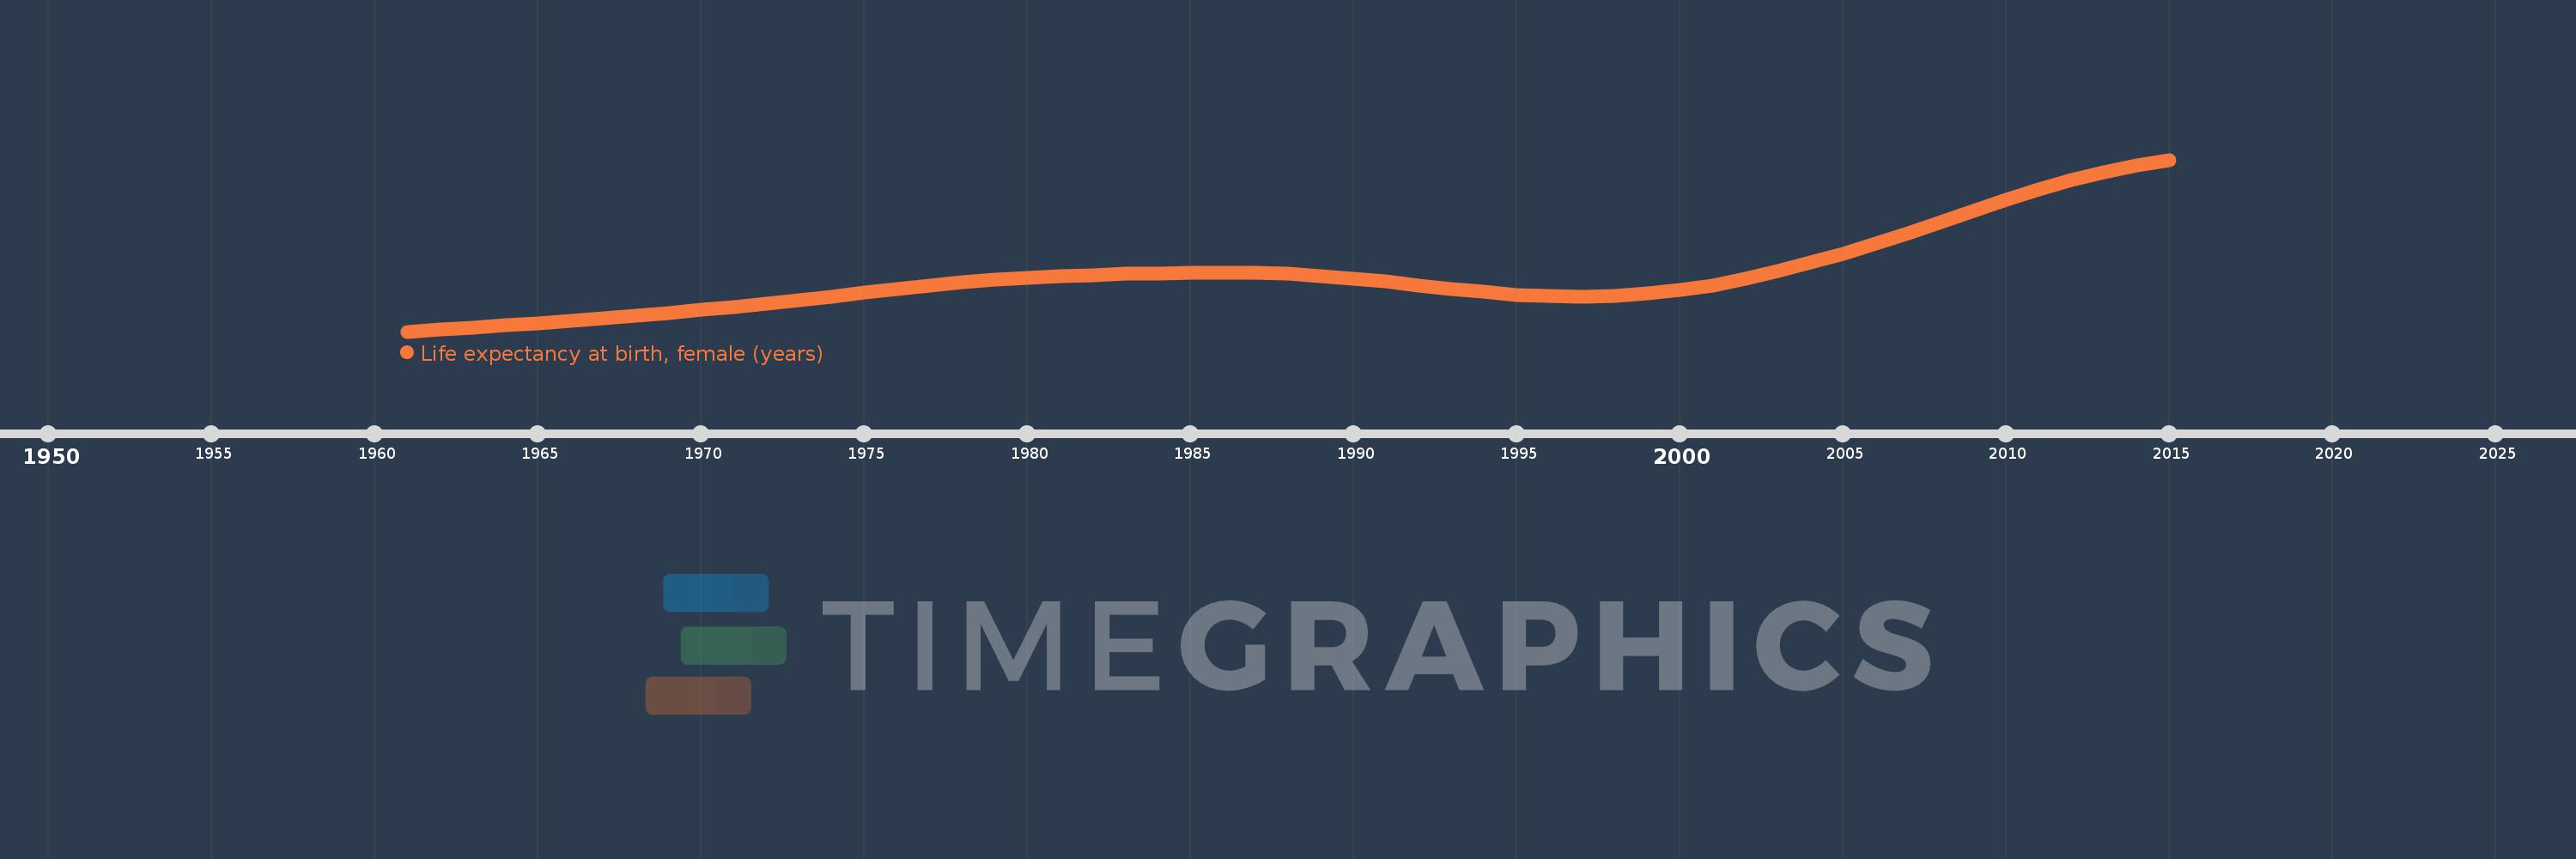
Life expectancy at birth, female (years)
2015,2014,2013,2012,2011,2010,2009,2008,2007,2006,2005,2004,2003,2002,2001,2000,1999,1998,1997,1996,1995,1994,1993,1992,1991,1990,1989,1988,1987,1986,1985,1984,1983,1982,1981,1980,1979,1978,1977,1976,1975,1974,1973,1972,1971,1970,1969,1968,1967,1966,1965,1964,1963,1962,1961
Diese Statistik in anderen Ländern:
AfghanistanAlbaniaAlgeriaAngolaAntigua and BarbudaArab WorldArgentinaArmeniaArubaAustraliaAustriaAzerbaijanBahamas, TheBahrainBangladeshBarbadosBelarusBelgiumBelizeBeninBermudaBhutanBoliviaBosnia and HerzegovinaBotswanaBrazilBrunei DarussalamBulgariaBurkina FasoBurundiCabo VerdeCambodiaCameroonCanadaCaribbean small statesCentral African RepublicCentral Europe and the BalticsChadChannel IslandsChileChinaColombiaComorosCongo, Dem. Rep.Congo, Rep.Costa RicaCote d'IvoireCroatiaCubaCuracaoCyprusCzech RepublicDenmarkDjiboutiDominicaDominican RepublicEarly-demographic dividendEast Asia & PacificEast Asia & Pacific (excluding high income)East Asia & Pacific (IDA & IBRD countries)EcuadorEgypt, Arab Rep.El SalvadorEquatorial GuineaEritreaEstoniaEthiopiaEuro areaEurope & Central AsiaEurope & Central Asia (excluding high income)Europe & Central Asia (IDA & IBRD countries)European UnionFaroe IslandsFijiFinlandFragile and conflict affected situationsFranceFrench PolynesiaGabonGambia, TheGeorgiaGermanyGhanaGreeceGreenlandGrenadaGuamGuatemalaGuineaGuinea-BissauGuyanaHaitiHeavily indebted poor countries (HIPC)High incomeHondurasHong Kong SAR, ChinaHungaryIBRD onlyIcelandIDA & IBRD totalIDA blendIDA onlyIDA totalIndiaIndonesiaIran, Islamic Rep.IraqIrelandIsle of ManIsraelItalyJamaicaJapanJordanKazakhstanKenyaKiribatiKorea, Dem. People’s Rep.Korea, Rep.KosovoKuwaitKyrgyz RepublicLao PDRLate-demographic dividendLatin America & Caribbean Latin America & Caribbean (excluding high income)Latin America & the Caribbean (IDA & IBRD countries)LatviaLeast developed countries: UN classificationLebanonLesothoLiberiaLibyaLiechtensteinLithuaniaLow & middle incomeLow incomeLower middle incomeLuxembourgMacao SAR, ChinaMacedonia, FYRMadagascarMalawiMalaysiaMaldivesMaliMaltaMarshall IslandsMauritaniaMauritiusMexicoMicronesia, Fed. Sts.Middle East & North AfricaMiddle East & North Africa (excluding high income)Middle East & North Africa (IDA & IBRD countries)Middle incomeMoldovaMongoliaMontenegroMoroccoMozambiqueMyanmarNamibiaNepalNetherlandsNew CaledoniaNew ZealandNicaraguaNigerNigeriaNorth AmericaNorwayOECD membersOmanOther small statesPacific island small statesPakistanPalauPanamaPapua New GuineaParaguayPeruPhilippinesPolandPortugalPost-demographic dividendPre-demographic dividendPuerto RicoQatarRomaniaRussian FederationRwandaSamoaSan MarinoSao Tome and PrincipeSaudi ArabiaSenegalSerbiaSeychellesSierra LeoneSingaporeSint Maarten (Dutch part)Slovak RepublicSloveniaSmall statesSolomon IslandsSomaliaSouth AfricaSouth AsiaSouth Asia (IDA & IBRD)South SudanSpainSri LankaSt. Kitts and NevisSt. LuciaSt. Martin (French part)St. Vincent and the GrenadinesSub-Saharan Africa Sub-Saharan Africa (excluding high income)Sub-Saharan Africa (IDA & IBRD countries)SudanSurinameSwazilandSwedenSwitzerlandSyrian Arab RepublicTajikistanTanzaniaThailandTimor-LesteTogoTongaTrinidad and TobagoTunisiaTurkeyTurkmenistanUgandaUkraineUnited Arab EmiratesUnited KingdomUnited StatesUpper middle incomeUruguayUzbekistanVanuatuVenezuela, RBVietnamVirgin Islands (U.S.)West Bank and GazaWorldYemen, Rep.ZambiaZimbabwe Zeitlinie:
Diese Zeitleiste vorliegt die Graphik ab 1961 J. bis 2015 J. Tanzania. Die Angaben bis 1960 J. sind nicht vorhanden. Die Zahl aktueller Beobachtungen nach Daten: 55.
Die Quelle (Bezeichnung):
Kennzahlen der Weltentwicklung
Die Quelle (Einrichtung):
(1) United Nations Population Division. World Population Prospects, (2) Census reports and other statistical publications from national statistical offices, (3) Eurostat: Demographic Statistics, (4) United Nations Statistical Division. Population and Vital Statistics Reprot (various years), (5) U.S. Census Bureau: International Database, and (6) Secretariat of the Pacific Community: Statistics and Demography Programme.
Kategorien:
Health, Gender, Social Development
Es wurde aktualisiert:
23 Apr 2017 Jahr
Kennzahlen der Wertänderungen vom Jahr zum Jahr
Minimum:
45.381
1 Jan 1961 Jahr
Maximum:
66.418
1 Jan 2015 Jahr
Zum Datum der Beobachtung
Wert
Absolute Veränderung
Die Veränderung bezüglich dem vorherigen Wert
1 Jan 1961 Jahr
45.381
+45.381
0.0%
1 Jan 1962 Jahr
45.638
+0.257
0.57%
1 Jan 1963 Jahr
45.895
+0.257
0.56%
1 Jan 1964 Jahr
46.158
+0.263
0.57%
1 Jan 1965 Jahr
46.432
+0.274
0.59%
1 Jan 1966 Jahr
46.722
+0.29
0.62%
1 Jan 1967 Jahr
47.027
+0.305
0.65%
1 Jan 1968 Jahr
47.347
+0.32
0.68%
1 Jan 1969 Jahr
47.681
+0.334
0.71%
1 Jan 1970 Jahr
48.031
+0.35
0.73%
1 Jan 1971 Jahr
48.402
+0.371
0.77%
1 Jan 1972 Jahr
48.804
+0.402
0.83%
1 Jan 1973 Jahr
49.235
+0.431
0.88%
1 Jan 1974 Jahr
49.69
+0.455
0.92%
1 Jan 1975 Jahr
50.154
+0.464
0.93%
1 Jan 1976 Jahr
50.61
+0.456
0.91%
1 Jan 1977 Jahr
51.036
+0.426
0.84%
1 Jan 1978 Jahr
51.414
+0.378
0.74%
1 Jan 1979 Jahr
51.732
+0.318
0.62%
1 Jan 1980 Jahr
51.984
+0.252
0.49%
1 Jan 1981 Jahr
52.176
+0.192
0.37%
1 Jan 1982 Jahr
52.321
+0.145
0.28%
1 Jan 1983 Jahr
52.438
+0.117
0.22%
1 Jan 1984 Jahr
52.533
+0.095
0.18%
1 Jan 1985 Jahr
52.603
+0.07
0.13%
1 Jan 1986 Jahr
52.627
+0.024
0.05%
1 Jan 1987 Jahr
52.576
-0.051
-0.1%
1 Jan 1988 Jahr
52.433
-0.143
-0.27%
1 Jan 1989 Jahr
52.194
-0.239
-0.46%
1 Jan 1990 Jahr
51.874
-0.32
-0.61%
1 Jan 1991 Jahr
51.487
-0.387
-0.75%
1 Jan 1992 Jahr
51.055
-0.432
-0.84%
1 Jan 1993 Jahr
50.618
-0.437
-0.86%
1 Jan 1994 Jahr
50.22
-0.398
-0.79%
1 Jan 1995 Jahr
49.9
-0.32
-0.64%
1 Jan 1996 Jahr
49.699
-0.201
-0.4%
1 Jan 1997 Jahr
49.646
-0.053
-0.11%
1 Jan 1998 Jahr
49.751
+0.105
0.21%
1 Jan 1999 Jahr
50.018
+0.267
0.54%
1 Jan 2000 Jahr
50.452
+0.434
0.87%
1 Jan 2001 Jahr
51.06
+0.608
1.21%
1 Jan 2002 Jahr
51.839
+0.779
1.53%
1 Jan 2003 Jahr
52.763
+0.924
1.78%
1 Jan 2004 Jahr
53.802
+1.039
1.97%
1 Jan 2005 Jahr
54.931
+1.129
2.1%
1 Jan 2006 Jahr
56.139
+1.208
2.2%
1 Jan 2007 Jahr
57.42
+1.281
2.28%
1 Jan 2008 Jahr
58.759
+1.339
2.33%
1 Jan 2009 Jahr
60.125
+1.366
2.32%
1 Jan 2010 Jahr
61.475
+1.35
2.25%
1 Jan 2011 Jahr
62.755
+1.28
2.08%
1 Jan 2012 Jahr
63.909
+1.154
1.84%
1 Jan 2013 Jahr
64.911
+1.002
1.57%
1 Jan 2014 Jahr
65.748
+0.837
1.29%
1 Jan 2015 Jahr
66.418
+0.67
1.02%
Bewertung der Länder gemäß mit laufender Statistik nach Jahren


Kommentare: