29
/de/
de
AIzaSyAYiBZKx7MnpbEhh9jyipgxe19OcubqV5w
April 1, 2024
104442
Channel Islands
CHI
true
2
1
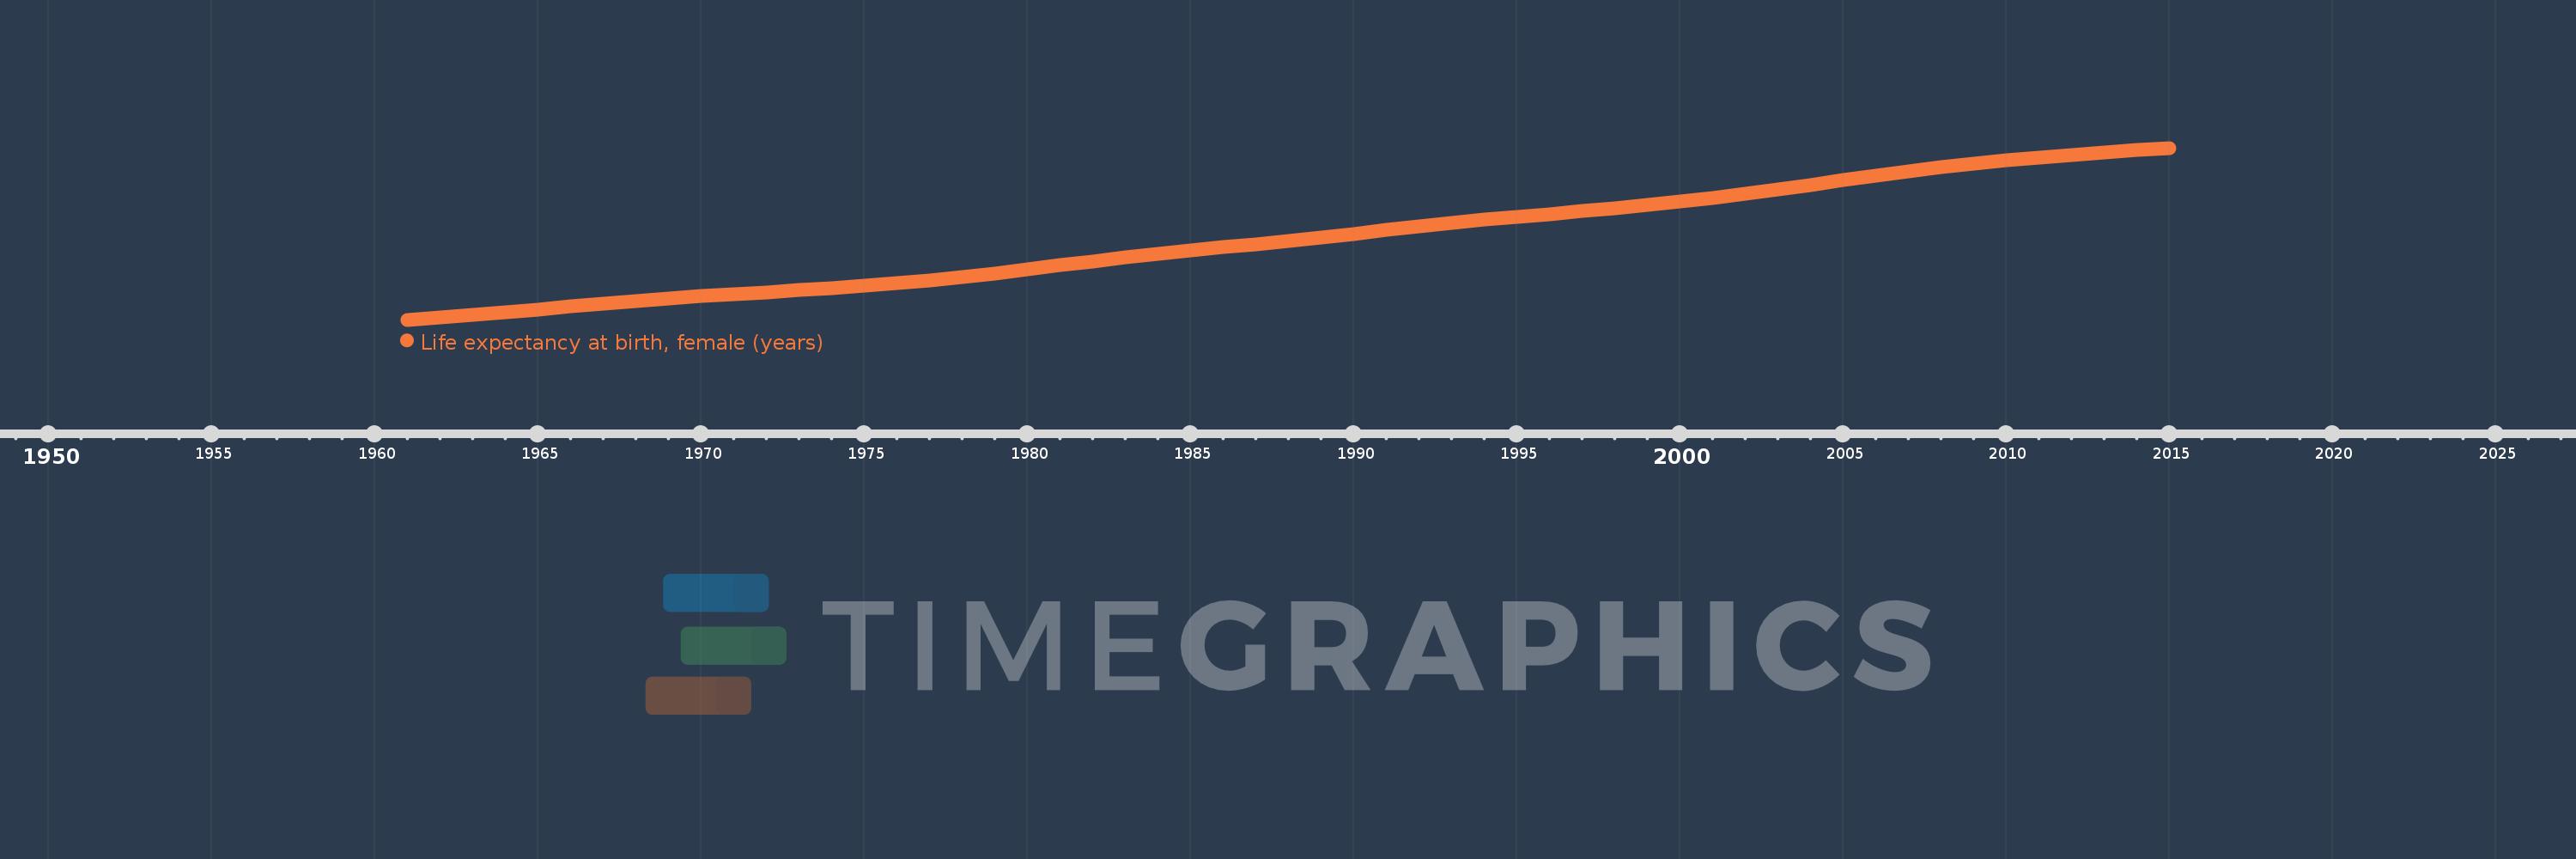
Life expectancy at birth, female (years)
2015,2014,2013,2012,2011,2010,2009,2008,2007,2006,2005,2004,2003,2002,2001,2000,1999,1998,1997,1996,1995,1994,1993,1992,1991,1990,1989,1988,1987,1986,1985,1984,1983,1982,1981,1980,1979,1978,1977,1976,1975,1974,1973,1972,1971,1970,1969,1968,1967,1966,1965,1964,1963,1962,1961
Diese Statistik in anderen Ländern:
AfghanistanAlbaniaAlgeriaAngolaAntigua and BarbudaArab WorldArgentinaArmeniaArubaAustraliaAustriaAzerbaijanBahamas, TheBahrainBangladeshBarbadosBelarusBelgiumBelizeBeninBermudaBhutanBoliviaBosnia and HerzegovinaBotswanaBrazilBrunei DarussalamBulgariaBurkina FasoBurundiCabo VerdeCambodiaCameroonCanadaCaribbean small statesCentral African RepublicCentral Europe and the BalticsChadChannel IslandsChileChinaColombiaComorosCongo, Dem. Rep.Congo, Rep.Costa RicaCote d'IvoireCroatiaCubaCuracaoCyprusCzech RepublicDenmarkDjiboutiDominicaDominican RepublicEarly-demographic dividendEast Asia & PacificEast Asia & Pacific (excluding high income)East Asia & Pacific (IDA & IBRD countries)EcuadorEgypt, Arab Rep.El SalvadorEquatorial GuineaEritreaEstoniaEthiopiaEuro areaEurope & Central AsiaEurope & Central Asia (excluding high income)Europe & Central Asia (IDA & IBRD countries)European UnionFaroe IslandsFijiFinlandFragile and conflict affected situationsFranceFrench PolynesiaGabonGambia, TheGeorgiaGermanyGhanaGreeceGreenlandGrenadaGuamGuatemalaGuineaGuinea-BissauGuyanaHaitiHeavily indebted poor countries (HIPC)High incomeHondurasHong Kong SAR, ChinaHungaryIBRD onlyIcelandIDA & IBRD totalIDA blendIDA onlyIDA totalIndiaIndonesiaIran, Islamic Rep.IraqIrelandIsle of ManIsraelItalyJamaicaJapanJordanKazakhstanKenyaKiribatiKorea, Dem. People’s Rep.Korea, Rep.KosovoKuwaitKyrgyz RepublicLao PDRLate-demographic dividendLatin America & Caribbean Latin America & Caribbean (excluding high income)Latin America & the Caribbean (IDA & IBRD countries)LatviaLeast developed countries: UN classificationLebanonLesothoLiberiaLibyaLiechtensteinLithuaniaLow & middle incomeLow incomeLower middle incomeLuxembourgMacao SAR, ChinaMacedonia, FYRMadagascarMalawiMalaysiaMaldivesMaliMaltaMarshall IslandsMauritaniaMauritiusMexicoMicronesia, Fed. Sts.Middle East & North AfricaMiddle East & North Africa (excluding high income)Middle East & North Africa (IDA & IBRD countries)Middle incomeMoldovaMongoliaMontenegroMoroccoMozambiqueMyanmarNamibiaNepalNetherlandsNew CaledoniaNew ZealandNicaraguaNigerNigeriaNorth AmericaNorwayOECD membersOmanOther small statesPacific island small statesPakistanPalauPanamaPapua New GuineaParaguayPeruPhilippinesPolandPortugalPost-demographic dividendPre-demographic dividendPuerto RicoQatarRomaniaRussian FederationRwandaSamoaSan MarinoSao Tome and PrincipeSaudi ArabiaSenegalSerbiaSeychellesSierra LeoneSingaporeSint Maarten (Dutch part)Slovak RepublicSloveniaSmall statesSolomon IslandsSomaliaSouth AfricaSouth AsiaSouth Asia (IDA & IBRD)South SudanSpainSri LankaSt. Kitts and NevisSt. LuciaSt. Martin (French part)St. Vincent and the GrenadinesSub-Saharan Africa Sub-Saharan Africa (excluding high income)Sub-Saharan Africa (IDA & IBRD countries)SudanSurinameSwazilandSwedenSwitzerlandSyrian Arab RepublicTajikistanTanzaniaThailandTimor-LesteTogoTongaTrinidad and TobagoTunisiaTurkeyTurkmenistanUgandaUkraineUnited Arab EmiratesUnited KingdomUnited StatesUpper middle incomeUruguayUzbekistanVanuatuVenezuela, RBVietnamVirgin Islands (U.S.)West Bank and GazaWorldYemen, Rep.ZambiaZimbabwe Zeitlinie:
Diese Zeitleiste vorliegt die Graphik ab 1961 J. bis 2015 J. Channel Islands. Die Angaben bis 1960 J. sind nicht vorhanden. Die Zahl aktueller Beobachtungen nach Daten: 55.
Die Quelle (Bezeichnung):
Kennzahlen der Weltentwicklung
Die Quelle (Einrichtung):
(1) United Nations Population Division. World Population Prospects, (2) Census reports and other statistical publications from national statistical offices, (3) Eurostat: Demographic Statistics, (4) United Nations Statistical Division. Population and Vital Statistics Reprot (various years), (5) U.S. Census Bureau: International Database, and (6) Secretariat of the Pacific Community: Statistics and Demography Programme.
Kategorien:
Health, Gender, Social Development
Es wurde aktualisiert:
23 Apr 2017 Jahr
Kennzahlen der Wertänderungen vom Jahr zum Jahr
Minimum:
73.61
1 Jan 1961 Jahr
Maximum:
82.581
1 Jan 2015 Jahr
Zum Datum der Beobachtung
Wert
Absolute Veränderung
Die Veränderung bezüglich dem vorherigen Wert
1 Jan 1961 Jahr
73.61
+73.61
0.0%
1 Jan 1962 Jahr
73.741
+0.131
0.18%
1 Jan 1963 Jahr
73.871
+0.13
0.18%
1 Jan 1964 Jahr
74.007
+0.136
0.18%
1 Jan 1965 Jahr
74.152
+0.145
0.2%
1 Jan 1966 Jahr
74.304
+0.152
0.2%
1 Jan 1967 Jahr
74.456
+0.152
0.2%
1 Jan 1968 Jahr
74.599
+0.143
0.19%
1 Jan 1969 Jahr
74.729
+0.13
0.17%
1 Jan 1970 Jahr
74.845
+0.116
0.16%
1 Jan 1971 Jahr
74.95
+0.105
0.14%
1 Jan 1972 Jahr
75.049
+0.099
0.13%
1 Jan 1973 Jahr
75.149
+0.1
0.13%
1 Jan 1974 Jahr
75.256
+0.107
0.14%
1 Jan 1975 Jahr
75.375
+0.119
0.16%
1 Jan 1976 Jahr
75.512
+0.137
0.18%
1 Jan 1977 Jahr
75.669
+0.157
0.21%
1 Jan 1978 Jahr
75.846
+0.177
0.23%
1 Jan 1979 Jahr
76.038
+0.192
0.25%
1 Jan 1980 Jahr
76.244
+0.206
0.27%
1 Jan 1981 Jahr
76.455
+0.211
0.28%
1 Jan 1982 Jahr
76.664
+0.209
0.27%
1 Jan 1983 Jahr
76.865
+0.201
0.26%
1 Jan 1984 Jahr
77.053
+0.188
0.24%
1 Jan 1985 Jahr
77.229
+0.176
0.23%
1 Jan 1986 Jahr
77.396
+0.167
0.22%
1 Jan 1987 Jahr
77.56
+0.164
0.21%
1 Jan 1988 Jahr
77.729
+0.169
0.22%
1 Jan 1989 Jahr
77.906
+0.177
0.23%
1 Jan 1990 Jahr
78.093
+0.187
0.24%
1 Jan 1991 Jahr
78.285
+0.192
0.25%
1 Jan 1992 Jahr
78.475
+0.19
0.24%
1 Jan 1993 Jahr
78.656
+0.181
0.23%
1 Jan 1994 Jahr
78.825
+0.169
0.21%
1 Jan 1995 Jahr
78.982
+0.157
0.2%
1 Jan 1996 Jahr
79.131
+0.149
0.19%
1 Jan 1997 Jahr
79.279
+0.148
0.19%
1 Jan 1998 Jahr
79.431
+0.152
0.19%
1 Jan 1999 Jahr
79.595
+0.164
0.21%
1 Jan 2000 Jahr
79.774
+0.179
0.22%
1 Jan 2001 Jahr
79.971
+0.197
0.25%
1 Jan 2002 Jahr
80.186
+0.215
0.27%
1 Jan 2003 Jahr
80.417
+0.231
0.29%
1 Jan 2004 Jahr
80.657
+0.24
0.3%
1 Jan 2005 Jahr
80.901
+0.244
0.3%
1 Jan 2006 Jahr
81.141
+0.24
0.3%
1 Jan 2007 Jahr
81.37
+0.229
0.28%
1 Jan 2008 Jahr
81.582
+0.212
0.26%
1 Jan 2009 Jahr
81.774
+0.192
0.24%
1 Jan 2010 Jahr
81.945
+0.171
0.21%
1 Jan 2011 Jahr
82.095
+0.15
0.18%
1 Jan 2012 Jahr
82.227
+0.132
0.16%
1 Jan 2013 Jahr
82.349
+0.122
0.15%
1 Jan 2014 Jahr
82.465
+0.116
0.14%
1 Jan 2015 Jahr
82.581
+0.116
0.14%
Bewertung der Länder gemäß mit laufender Statistik nach Jahren


Kommentare: