29
/de/
de
AIzaSyAYiBZKx7MnpbEhh9jyipgxe19OcubqV5w
April 1, 2024
68196
Angola
AGO
true
2
1
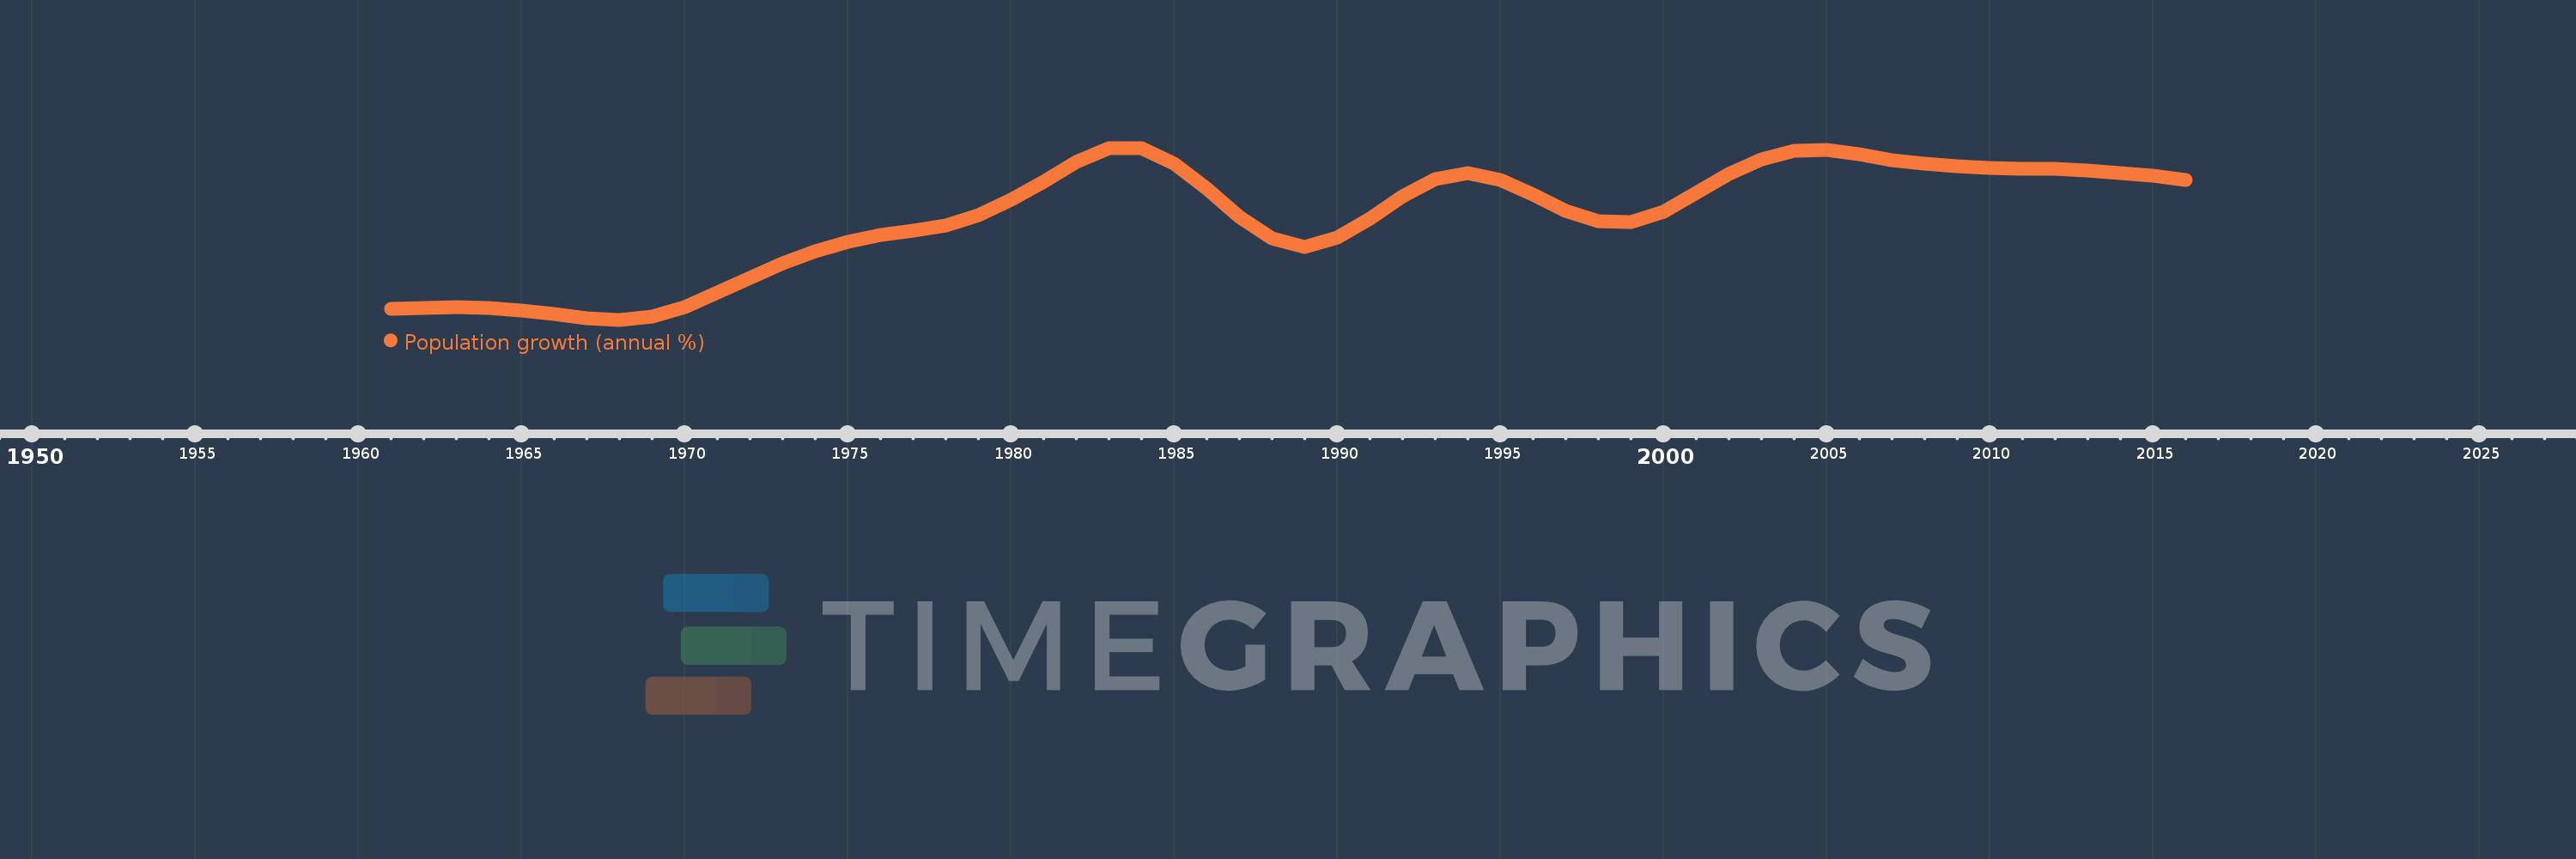
Population growth (annual %)
2016,2015,2014,2013,2012,2011,2010,2009,2008,2007,2006,2005,2004,2003,2002,2001,2000,1999,1998,1997,1996,1995,1994,1993,1992,1991,1990,1989,1988,1987,1986,1985,1984,1983,1982,1981,1980,1979,1978,1977,1976,1975,1974,1973,1972,1971,1970,1969,1968,1967,1966,1965,1964,1963,1962,1961
Diese Statistik in anderen Ländern:
AfghanistanAlbaniaAlgeriaAmerican SamoaAndorraAngolaAntigua and BarbudaArab WorldArgentinaArmeniaArubaAustraliaAustriaAzerbaijanBahamas, TheBahrainBangladeshBarbadosBelarusBelgiumBelizeBeninBermudaBhutanBoliviaBosnia and HerzegovinaBotswanaBrazilBritish Virgin IslandsBrunei DarussalamBulgariaBurkina FasoBurundiCabo VerdeCambodiaCameroonCanadaCaribbean small statesCayman IslandsCentral African RepublicCentral Europe and the BalticsChadChannel IslandsChileChinaColombiaComorosCongo, Dem. Rep.Congo, Rep.Costa RicaCote d'IvoireCroatiaCubaCuracaoCyprusCzech RepublicDenmarkDjiboutiDominicaDominican RepublicEarly-demographic dividendEast Asia & PacificEast Asia & Pacific (excluding high income)East Asia & Pacific (IDA & IBRD countries)EcuadorEgypt, Arab Rep.El SalvadorEquatorial GuineaEritreaEstoniaEthiopiaEuro areaEurope & Central AsiaEurope & Central Asia (excluding high income)Europe & Central Asia (IDA & IBRD countries)European UnionFaroe IslandsFijiFinlandFragile and conflict affected situationsFranceFrench PolynesiaGabonGambia, TheGeorgiaGermanyGhanaGibraltarGreeceGreenlandGrenadaGuamGuatemalaGuineaGuinea-BissauGuyanaHaitiHeavily indebted poor countries (HIPC)High incomeHondurasHong Kong SAR, ChinaHungaryIBRD onlyIcelandIDA & IBRD totalIDA blendIDA onlyIDA totalIndiaIndonesiaIran, Islamic Rep.IraqIrelandIsle of ManIsraelItalyJamaicaJapanJordanKazakhstanKenyaKiribatiKorea, Dem. People’s Rep.Korea, Rep.KosovoKuwaitKyrgyz RepublicLao PDRLate-demographic dividendLatin America & Caribbean Latin America & Caribbean (excluding high income)Latin America & the Caribbean (IDA & IBRD countries)LatviaLeast developed countries: UN classificationLebanonLesothoLiberiaLibyaLiechtensteinLithuaniaLow & middle incomeLow incomeLower middle incomeLuxembourgMacao SAR, ChinaMacedonia, FYRMadagascarMalawiMalaysiaMaldivesMaliMaltaMarshall IslandsMauritaniaMauritiusMexicoMicronesia, Fed. Sts.Middle East & North AfricaMiddle East & North Africa (excluding high income)Middle East & North Africa (IDA & IBRD countries)Middle incomeMoldovaMonacoMongoliaMontenegroMoroccoMozambiqueMyanmarNamibiaNauruNepalNetherlandsNew CaledoniaNew ZealandNicaraguaNigerNigeriaNorth AmericaNorthern Mariana IslandsNorwayOECD membersOmanOther small statesPacific island small statesPakistanPalauPanamaPapua New GuineaParaguayPeruPhilippinesPolandPortugalPost-demographic dividendPre-demographic dividendPuerto RicoQatarRomaniaRussian FederationRwandaSamoaSan MarinoSao Tome and PrincipeSaudi ArabiaSenegalSerbiaSeychellesSierra LeoneSingaporeSint Maarten (Dutch part)Slovak RepublicSloveniaSmall statesSolomon IslandsSomaliaSouth AfricaSouth AsiaSouth Asia (IDA & IBRD)South SudanSpainSri LankaSt. Kitts and NevisSt. LuciaSt. Martin (French part)St. Vincent and the GrenadinesSub-Saharan Africa Sub-Saharan Africa (excluding high income)Sub-Saharan Africa (IDA & IBRD countries)SudanSurinameSwazilandSwedenSwitzerlandSyrian Arab RepublicTajikistanTanzaniaThailandTimor-LesteTogoTongaTrinidad and TobagoTunisiaTurkeyTurkmenistanTurks and Caicos IslandsTuvaluUgandaUkraineUnited Arab EmiratesUnited KingdomUnited StatesUpper middle incomeUruguayUzbekistanVanuatuVenezuela, RBVietnamVirgin Islands (U.S.)West Bank and GazaWorldYemen, Rep.ZambiaZimbabwe Zeitlinie:
Diese Zeitleiste vorliegt die Graphik ab 1961 J. bis 2016 J. Angola. Die Angaben bis 1960 J. sind nicht vorhanden. Die Zahl aktueller Beobachtungen nach Daten: 56.
Die Quelle (Bezeichnung):
Kennzahlen der Weltentwicklung
Die Quelle (Einrichtung):
Derived from total population. Population source: (1) United Nations Population Division. World Population Prospects, (2) United Nations Statistical Division. Population and Vital Statistics Report (various years), (3) Census reports and other statistical
Kategorien:
Climate Change, Health
Es wurde aktualisiert:
23 Apr 2017 Jahr
Kennzahlen der Wertänderungen vom Jahr zum Jahr
Minimum:
1.679
1 Jan 1968 Jahr
Maximum:
3.581
1 Jan 1984 Jahr
Zum Datum der Beobachtung
Wert
Absolute Veränderung
Die Veränderung bezüglich dem vorherigen Wert
1 Jan 1961 Jahr
1.803
+1.803
0.0%
1 Jan 1962 Jahr
1.813
+0.01
0.57%
1 Jan 1963 Jahr
1.821
+0.008
0.41%
1 Jan 1964 Jahr
1.811
-0.009
-0.52%
1 Jan 1965 Jahr
1.779
-0.032
-1.79%
1 Jan 1966 Jahr
1.738
-0.041
-2.3%
1 Jan 1967 Jahr
1.695
-0.043
-2.47%
1 Jan 1968 Jahr
1.679
-0.016
-0.95%
1 Jan 1969 Jahr
1.717
+0.038
2.28%
1 Jan 1970 Jahr
1.823
+0.106
6.19%
1 Jan 1971 Jahr
1.976
+0.153
8.37%
1 Jan 1972 Jahr
2.146
+0.17
8.62%
1 Jan 1973 Jahr
2.303
+0.157
7.34%
1 Jan 1974 Jahr
2.438
+0.134
5.84%
1 Jan 1975 Jahr
2.538
+0.1
4.12%
1 Jan 1976 Jahr
2.617
+0.079
3.1%
1 Jan 1977 Jahr
2.668
+0.051
1.95%
1 Jan 1978 Jahr
2.727
+0.059
2.22%
1 Jan 1979 Jahr
2.836
+0.109
4.01%
1 Jan 1980 Jahr
3.009
+0.173
6.08%
1 Jan 1981 Jahr
3.206
+0.197
6.53%
1 Jan 1982 Jahr
3.423
+0.218
6.8%
1 Jan 1983 Jahr
3.578
+0.155
4.51%
1 Jan 1984 Jahr
3.581
+0.003
0.09%
1 Jan 1985 Jahr
3.406
-0.176
-4.9%
1 Jan 1986 Jahr
3.13
-0.276
-8.1%
1 Jan 1987 Jahr
2.818
-0.312
-9.98%
1 Jan 1988 Jahr
2.58
-0.237
-8.42%
1 Jan 1989 Jahr
2.489
-0.092
-3.55%
1 Jan 1990 Jahr
2.585
+0.096
3.85%
1 Jan 1991 Jahr
2.796
+0.212
8.2%
1 Jan 1992 Jahr
3.047
+0.251
8.96%
1 Jan 1993 Jahr
3.232
+0.185
6.06%
1 Jan 1994 Jahr
3.302
+0.071
2.18%
1 Jan 1995 Jahr
3.227
-0.075
-2.27%
1 Jan 1996 Jahr
3.069
-0.159
-4.91%
1 Jan 1997 Jahr
2.888
-0.181
-5.9%
1 Jan 1998 Jahr
2.77
-0.118
-4.08%
1 Jan 1999 Jahr
2.757
-0.013
-0.46%
1 Jan 2000 Jahr
2.878
+0.121
4.39%
1 Jan 2001 Jahr
3.079
+0.201
6.99%
1 Jan 2002 Jahr
3.293
+0.214
6.94%
1 Jan 2003 Jahr
3.454
+0.161
4.88%
1 Jan 2004 Jahr
3.547
+0.093
2.7%
1 Jan 2005 Jahr
3.555
+0.008
0.23%
1 Jan 2006 Jahr
3.508
-0.048
-1.34%
1 Jan 2007 Jahr
3.449
-0.059
-1.68%
1 Jan 2008 Jahr
3.406
-0.042
-1.23%
1 Jan 2009 Jahr
3.374
-0.032
-0.94%
1 Jan 2010 Jahr
3.359
-0.015
-0.45%
1 Jan 2011 Jahr
3.354
-0.005
-0.16%
1 Jan 2012 Jahr
3.347
-0.006
-0.19%
1 Jan 2013 Jahr
3.332
-0.016
-0.47%
1 Jan 2014 Jahr
3.306
-0.025
-0.76%
1 Jan 2015 Jahr
3.27
-0.037
-1.11%
1 Jan 2016 Jahr
3.227
-0.043
-1.32%
Bewertung der Länder gemäß mit laufender Statistik nach Jahren


Kommentare: