29
/de/
de
AIzaSyAYiBZKx7MnpbEhh9jyipgxe19OcubqV5w
April 1, 2024
34531
Fragile and conflict affected situations
FCS
false
2
1
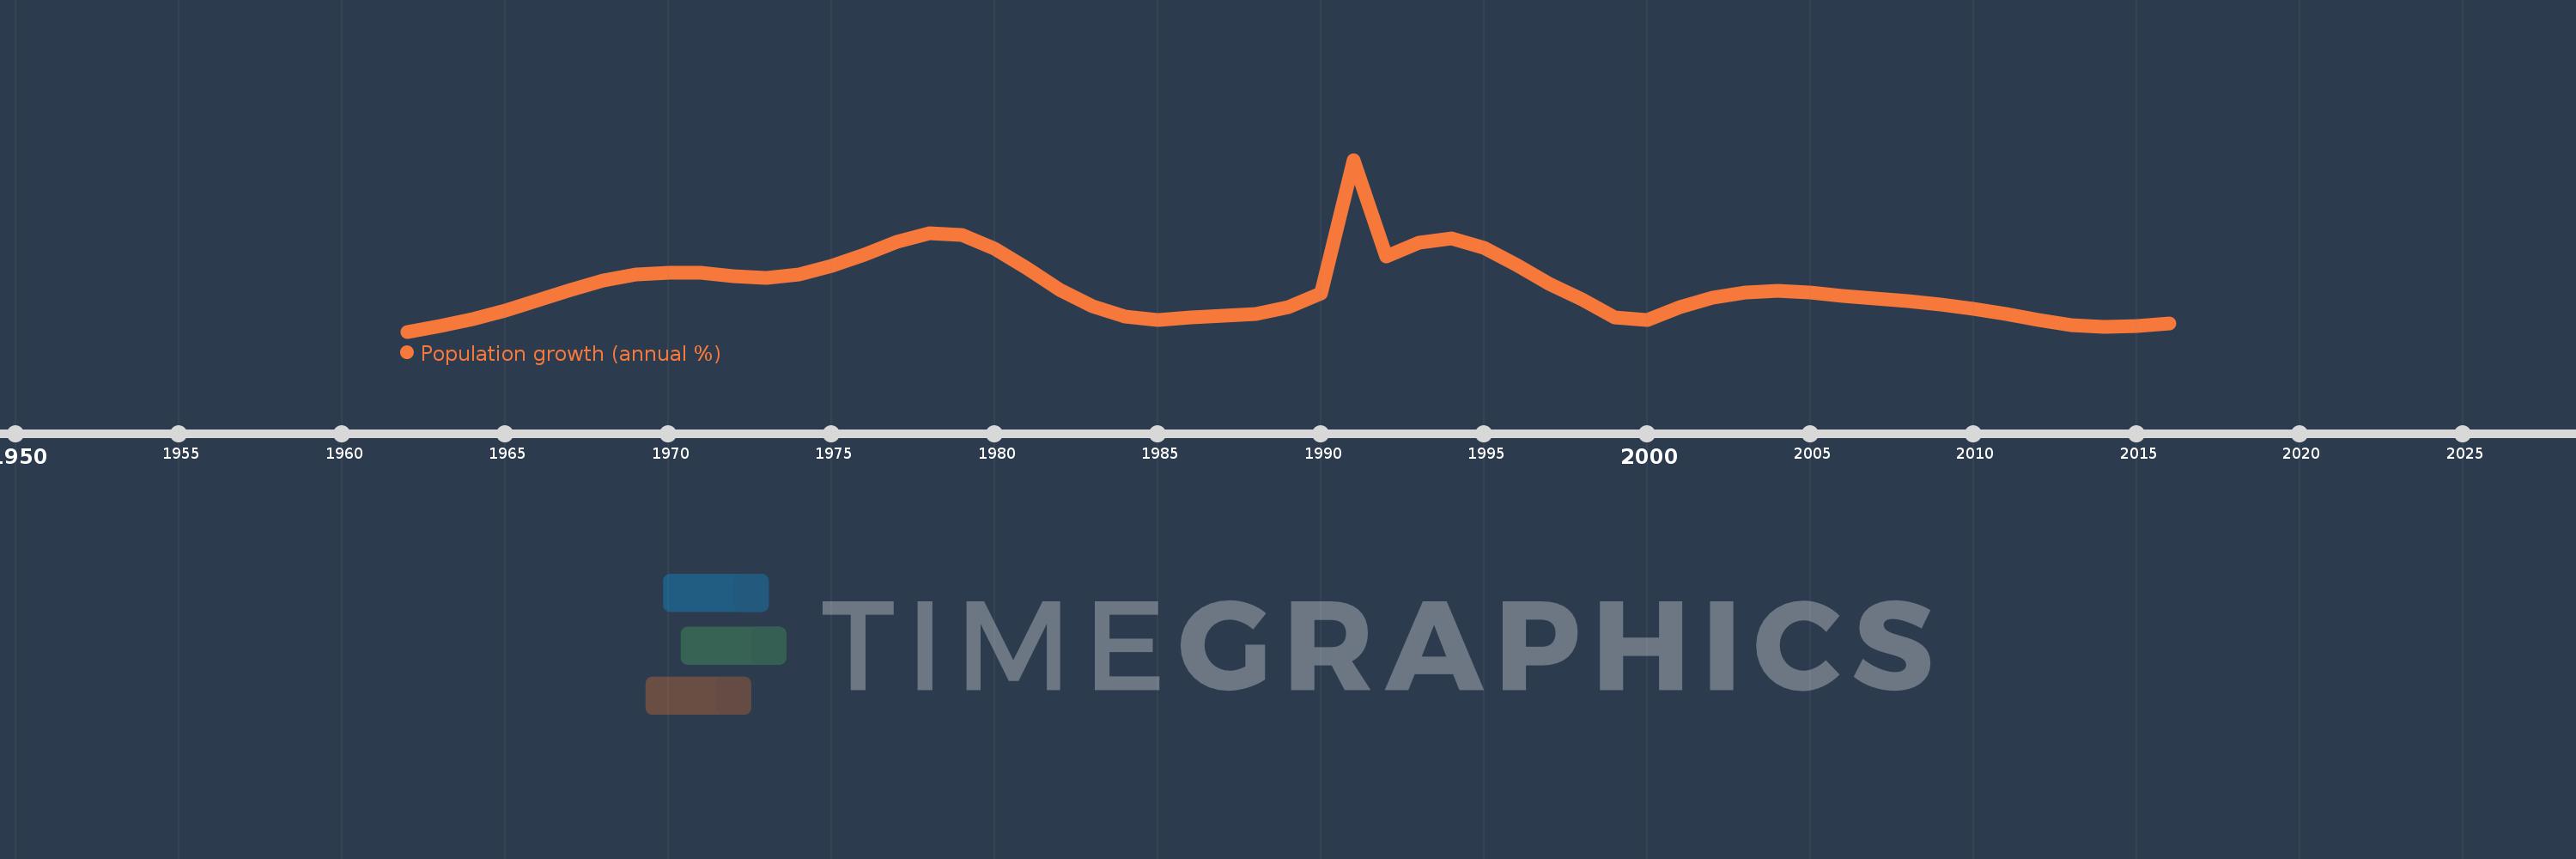
Population growth (annual %)
2016,2015,2014,2013,2012,2011,2010,2009,2008,2007,2006,2005,2004,2003,2002,2001,2000,1999,1998,1997,1996,1995,1994,1993,1992,1991,1990,1989,1988,1987,1986,1985,1984,1983,1982,1981,1980,1979,1978,1977,1976,1975,1974,1973,1972,1971,1970,1969,1968,1967,1966,1965,1964,1963,1962
Diese Statistik in anderen Ländern:
AfghanistanAlbaniaAlgeriaAmerican SamoaAndorraAngolaAntigua and BarbudaArab WorldArgentinaArmeniaArubaAustraliaAustriaAzerbaijanBahamas, TheBahrainBangladeshBarbadosBelarusBelgiumBelizeBeninBermudaBhutanBoliviaBosnia and HerzegovinaBotswanaBrazilBritish Virgin IslandsBrunei DarussalamBulgariaBurkina FasoBurundiCabo VerdeCambodiaCameroonCanadaCaribbean small statesCayman IslandsCentral African RepublicCentral Europe and the BalticsChadChannel IslandsChileChinaColombiaComorosCongo, Dem. Rep.Congo, Rep.Costa RicaCote d'IvoireCroatiaCubaCuracaoCyprusCzech RepublicDenmarkDjiboutiDominicaDominican RepublicEarly-demographic dividendEast Asia & PacificEast Asia & Pacific (excluding high income)East Asia & Pacific (IDA & IBRD countries)EcuadorEgypt, Arab Rep.El SalvadorEquatorial GuineaEritreaEstoniaEthiopiaEuro areaEurope & Central AsiaEurope & Central Asia (excluding high income)Europe & Central Asia (IDA & IBRD countries)European UnionFaroe IslandsFijiFinlandFragile and conflict affected situationsFranceFrench PolynesiaGabonGambia, TheGeorgiaGermanyGhanaGibraltarGreeceGreenlandGrenadaGuamGuatemalaGuineaGuinea-BissauGuyanaHaitiHeavily indebted poor countries (HIPC)High incomeHondurasHong Kong SAR, ChinaHungaryIBRD onlyIcelandIDA & IBRD totalIDA blendIDA onlyIDA totalIndiaIndonesiaIran, Islamic Rep.IraqIrelandIsle of ManIsraelItalyJamaicaJapanJordanKazakhstanKenyaKiribatiKorea, Dem. People’s Rep.Korea, Rep.KosovoKuwaitKyrgyz RepublicLao PDRLate-demographic dividendLatin America & Caribbean Latin America & Caribbean (excluding high income)Latin America & the Caribbean (IDA & IBRD countries)LatviaLeast developed countries: UN classificationLebanonLesothoLiberiaLibyaLiechtensteinLithuaniaLow & middle incomeLow incomeLower middle incomeLuxembourgMacao SAR, ChinaMacedonia, FYRMadagascarMalawiMalaysiaMaldivesMaliMaltaMarshall IslandsMauritaniaMauritiusMexicoMicronesia, Fed. Sts.Middle East & North AfricaMiddle East & North Africa (excluding high income)Middle East & North Africa (IDA & IBRD countries)Middle incomeMoldovaMonacoMongoliaMontenegroMoroccoMozambiqueMyanmarNamibiaNauruNepalNetherlandsNew CaledoniaNew ZealandNicaraguaNigerNigeriaNorth AmericaNorthern Mariana IslandsNorwayOECD membersOmanOther small statesPacific island small statesPakistanPalauPanamaPapua New GuineaParaguayPeruPhilippinesPolandPortugalPost-demographic dividendPre-demographic dividendPuerto RicoQatarRomaniaRussian FederationRwandaSamoaSan MarinoSao Tome and PrincipeSaudi ArabiaSenegalSerbiaSeychellesSierra LeoneSingaporeSint Maarten (Dutch part)Slovak RepublicSloveniaSmall statesSolomon IslandsSomaliaSouth AfricaSouth AsiaSouth Asia (IDA & IBRD)South SudanSpainSri LankaSt. Kitts and NevisSt. LuciaSt. Martin (French part)St. Vincent and the GrenadinesSub-Saharan Africa Sub-Saharan Africa (excluding high income)Sub-Saharan Africa (IDA & IBRD countries)SudanSurinameSwazilandSwedenSwitzerlandSyrian Arab RepublicTajikistanTanzaniaThailandTimor-LesteTogoTongaTrinidad and TobagoTunisiaTurkeyTurkmenistanTurks and Caicos IslandsTuvaluUgandaUkraineUnited Arab EmiratesUnited KingdomUnited StatesUpper middle incomeUruguayUzbekistanVanuatuVenezuela, RBVietnamVirgin Islands (U.S.)West Bank and GazaWorldYemen, Rep.ZambiaZimbabwe Zeitlinie:
Diese Zeitleiste vorliegt die Graphik ab 1962 J. bis 2016 J. Fragile and conflict affected situations. Die Angaben bis 1961 J. sind nicht vorhanden. Die Zahl aktueller Beobachtungen nach Daten: 55.
Die Quelle (Bezeichnung):
Kennzahlen der Weltentwicklung
Die Quelle (Einrichtung):
Derived from total population. Population source: (1) United Nations Population Division. World Population Prospects, (2) United Nations Statistical Division. Population and Vital Statistics Report (various years), (3) Census reports and other statistical
Kategorien:
Climate Change, Health
Es wurde aktualisiert:
23 Apr 2017 Jahr
Kennzahlen der Wertänderungen vom Jahr zum Jahr
Minimum:
2.307
1 Jan 1962 Jahr
Maximum:
3.466
1 Jan 1991 Jahr
Zum Datum der Beobachtung
Wert
Absolute Veränderung
Die Veränderung bezüglich dem vorherigen Wert
1 Jan 1962 Jahr
2.307
+2.307
0.0%
1 Jan 1963 Jahr
2.346
+0.039
1.7%
1 Jan 1964 Jahr
2.39
+0.044
1.87%
1 Jan 1965 Jahr
2.45
+0.06
2.51%
1 Jan 1966 Jahr
2.519
+0.068
2.79%
1 Jan 1967 Jahr
2.59
+0.072
2.85%
1 Jan 1968 Jahr
2.652
+0.062
2.4%
1 Jan 1969 Jahr
2.692
+0.039
1.48%
1 Jan 1970 Jahr
2.705
+0.013
0.49%
1 Jan 1971 Jahr
2.702
-0.003
-0.12%
1 Jan 1972 Jahr
2.682
-0.019
-0.71%
1 Jan 1973 Jahr
2.672
-0.01
-0.38%
1 Jan 1974 Jahr
2.69
+0.018
0.66%
1 Jan 1975 Jahr
2.748
+0.058
2.17%
1 Jan 1976 Jahr
2.824
+0.076
2.76%
1 Jan 1977 Jahr
2.911
+0.087
3.09%
1 Jan 1978 Jahr
2.968
+0.056
1.93%
1 Jan 1979 Jahr
2.958
-0.009
-0.31%
1 Jan 1980 Jahr
2.869
-0.089
-3.01%
1 Jan 1981 Jahr
2.732
-0.138
-4.8%
1 Jan 1982 Jahr
2.59
-0.142
-5.21%
1 Jan 1983 Jahr
2.478
-0.112
-4.31%
1 Jan 1984 Jahr
2.406
-0.072
-2.89%
1 Jan 1985 Jahr
2.385
-0.021
-0.88%
1 Jan 1986 Jahr
2.402
+0.017
0.72%
1 Jan 1987 Jahr
2.415
+0.012
0.52%
1 Jan 1988 Jahr
2.426
+0.011
0.47%
1 Jan 1989 Jahr
2.475
+0.049
2.01%
1 Jan 1990 Jahr
2.565
+0.089
3.61%
1 Jan 1991 Jahr
3.466
+0.901
35.14%
1 Jan 1992 Jahr
2.814
-0.652
-18.81%
1 Jan 1993 Jahr
2.909
+0.095
3.38%
1 Jan 1994 Jahr
2.934
+0.025
0.86%
1 Jan 1995 Jahr
2.872
-0.062
-2.11%
1 Jan 1996 Jahr
2.757
-0.115
-4.01%
1 Jan 1997 Jahr
2.627
-0.13
-4.73%
1 Jan 1998 Jahr
2.525
-0.102
-3.88%
1 Jan 1999 Jahr
2.404
-0.12
-4.77%
1 Jan 2000 Jahr
2.383
-0.021
-0.87%
1 Jan 2001 Jahr
2.471
+0.088
3.69%
1 Jan 2002 Jahr
2.538
+0.067
2.71%
1 Jan 2003 Jahr
2.568
+0.029
1.15%
1 Jan 2004 Jahr
2.581
+0.014
0.53%
1 Jan 2005 Jahr
2.573
-0.008
-0.32%
1 Jan 2006 Jahr
2.55
-0.024
-0.91%
1 Jan 2007 Jahr
2.531
-0.019
-0.74%
1 Jan 2008 Jahr
2.513
-0.018
-0.71%
1 Jan 2009 Jahr
2.491
-0.022
-0.87%
1 Jan 2010 Jahr
2.459
-0.032
-1.29%
1 Jan 2011 Jahr
2.423
-0.035
-1.43%
1 Jan 2012 Jahr
2.385
-0.038
-1.56%
1 Jan 2013 Jahr
2.353
-0.033
-1.38%
1 Jan 2014 Jahr
2.338
-0.015
-0.62%
1 Jan 2015 Jahr
2.343
+0.005
0.21%
1 Jan 2016 Jahr
2.364
+0.021
0.9%
Bewertung der Länder gemäß mit laufender Statistik nach Jahren


Kommentare: