29
/de/
de
AIzaSyAYiBZKx7MnpbEhh9jyipgxe19OcubqV5w
April 1, 2024
172102
Kuwait
KWT
true
2
1
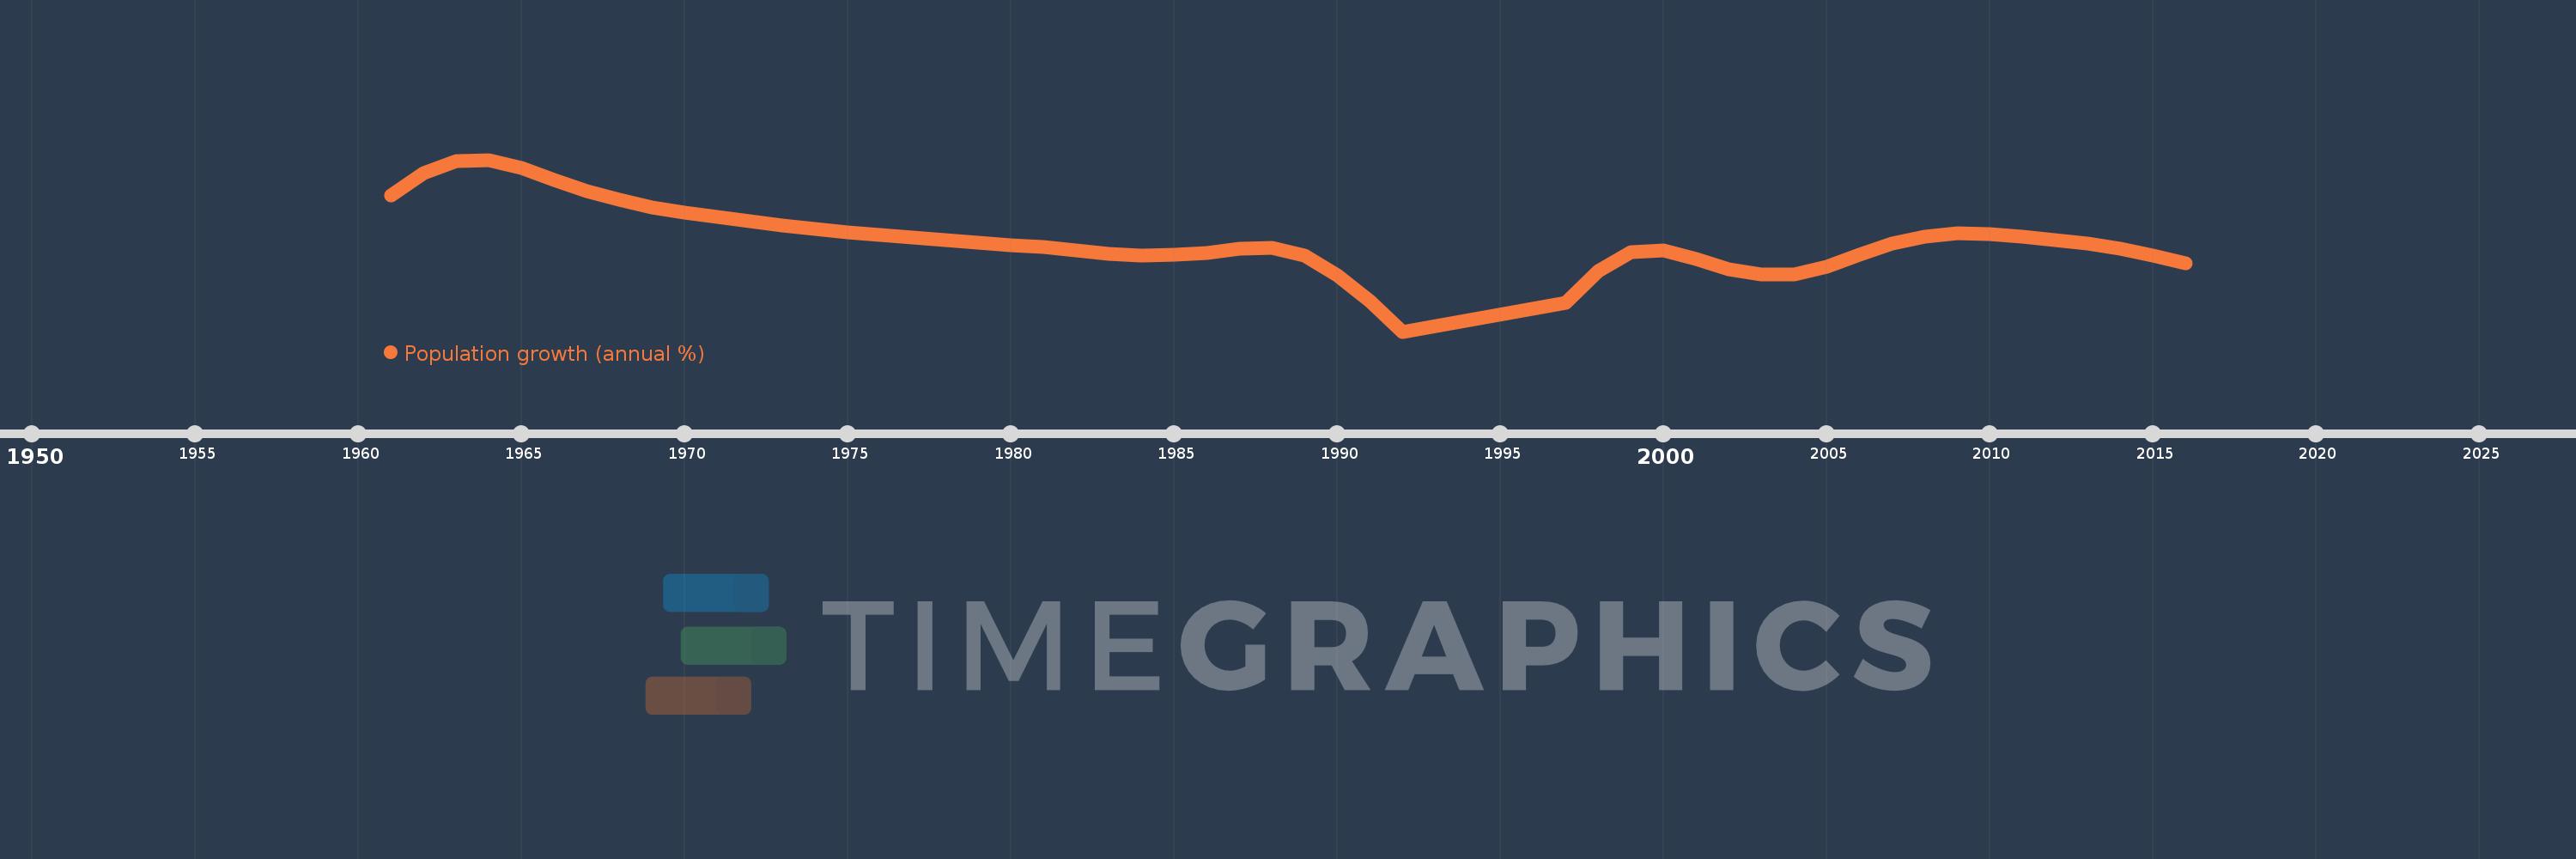
Population growth (annual %)
2016,2015,2014,2013,2012,2011,2010,2009,2008,2007,2006,2005,2004,2003,2002,2001,2000,1999,1998,1997,1992,1991,1990,1989,1988,1987,1986,1985,1984,1983,1982,1981,1980,1979,1978,1977,1976,1975,1974,1973,1972,1971,1970,1969,1968,1967,1966,1965,1964,1963,1962,1961
Diese Statistik in anderen Ländern:
AfghanistanAlbaniaAlgeriaAmerican SamoaAndorraAngolaAntigua and BarbudaArab WorldArgentinaArmeniaArubaAustraliaAustriaAzerbaijanBahamas, TheBahrainBangladeshBarbadosBelarusBelgiumBelizeBeninBermudaBhutanBoliviaBosnia and HerzegovinaBotswanaBrazilBritish Virgin IslandsBrunei DarussalamBulgariaBurkina FasoBurundiCabo VerdeCambodiaCameroonCanadaCaribbean small statesCayman IslandsCentral African RepublicCentral Europe and the BalticsChadChannel IslandsChileChinaColombiaComorosCongo, Dem. Rep.Congo, Rep.Costa RicaCote d'IvoireCroatiaCubaCuracaoCyprusCzech RepublicDenmarkDjiboutiDominicaDominican RepublicEarly-demographic dividendEast Asia & PacificEast Asia & Pacific (excluding high income)East Asia & Pacific (IDA & IBRD countries)EcuadorEgypt, Arab Rep.El SalvadorEquatorial GuineaEritreaEstoniaEthiopiaEuro areaEurope & Central AsiaEurope & Central Asia (excluding high income)Europe & Central Asia (IDA & IBRD countries)European UnionFaroe IslandsFijiFinlandFragile and conflict affected situationsFranceFrench PolynesiaGabonGambia, TheGeorgiaGermanyGhanaGibraltarGreeceGreenlandGrenadaGuamGuatemalaGuineaGuinea-BissauGuyanaHaitiHeavily indebted poor countries (HIPC)High incomeHondurasHong Kong SAR, ChinaHungaryIBRD onlyIcelandIDA & IBRD totalIDA blendIDA onlyIDA totalIndiaIndonesiaIran, Islamic Rep.IraqIrelandIsle of ManIsraelItalyJamaicaJapanJordanKazakhstanKenyaKiribatiKorea, Dem. People’s Rep.Korea, Rep.KosovoKuwaitKyrgyz RepublicLao PDRLate-demographic dividendLatin America & Caribbean Latin America & Caribbean (excluding high income)Latin America & the Caribbean (IDA & IBRD countries)LatviaLeast developed countries: UN classificationLebanonLesothoLiberiaLibyaLiechtensteinLithuaniaLow & middle incomeLow incomeLower middle incomeLuxembourgMacao SAR, ChinaMacedonia, FYRMadagascarMalawiMalaysiaMaldivesMaliMaltaMarshall IslandsMauritaniaMauritiusMexicoMicronesia, Fed. Sts.Middle East & North AfricaMiddle East & North Africa (excluding high income)Middle East & North Africa (IDA & IBRD countries)Middle incomeMoldovaMonacoMongoliaMontenegroMoroccoMozambiqueMyanmarNamibiaNauruNepalNetherlandsNew CaledoniaNew ZealandNicaraguaNigerNigeriaNorth AmericaNorthern Mariana IslandsNorwayOECD membersOmanOther small statesPacific island small statesPakistanPalauPanamaPapua New GuineaParaguayPeruPhilippinesPolandPortugalPost-demographic dividendPre-demographic dividendPuerto RicoQatarRomaniaRussian FederationRwandaSamoaSan MarinoSao Tome and PrincipeSaudi ArabiaSenegalSerbiaSeychellesSierra LeoneSingaporeSint Maarten (Dutch part)Slovak RepublicSloveniaSmall statesSolomon IslandsSomaliaSouth AfricaSouth AsiaSouth Asia (IDA & IBRD)South SudanSpainSri LankaSt. Kitts and NevisSt. LuciaSt. Martin (French part)St. Vincent and the GrenadinesSub-Saharan Africa Sub-Saharan Africa (excluding high income)Sub-Saharan Africa (IDA & IBRD countries)SudanSurinameSwazilandSwedenSwitzerlandSyrian Arab RepublicTajikistanTanzaniaThailandTimor-LesteTogoTongaTrinidad and TobagoTunisiaTurkeyTurkmenistanTurks and Caicos IslandsTuvaluUgandaUkraineUnited Arab EmiratesUnited KingdomUnited StatesUpper middle incomeUruguayUzbekistanVanuatuVenezuela, RBVietnamVirgin Islands (U.S.)West Bank and GazaWorldYemen, Rep.ZambiaZimbabwe Zeitlinie:
Diese Zeitleiste vorliegt die Graphik ab 1961 J. bis 2016 J. Kuwait. Die Angaben bis 1960 J. sind nicht vorhanden. Die Zahl aktueller Beobachtungen nach Daten: 52.
Die Quelle (Bezeichnung):
Kennzahlen der Weltentwicklung
Die Quelle (Einrichtung):
Derived from total population. Population source: (1) United Nations Population Division. World Population Prospects, (2) United Nations Statistical Division. Population and Vital Statistics Report (various years), (3) Census reports and other statistical
Kategorien:
Climate Change, Health
Es wurde aktualisiert:
23 Apr 2017 Jahr
Kennzahlen der Wertänderungen vom Jahr zum Jahr
Minimum:
-2.544
1 Jan 1992 Jahr
Maximum:
12.993
1 Jan 1964 Jahr
Zum Datum der Beobachtung
Wert
Absolute Veränderung
Die Veränderung bezüglich dem vorherigen Wert
1 Jan 1961 Jahr
9.796
+9.796
0.0%
1 Jan 1962 Jahr
11.755
+1.959
19.99%
1 Jan 1963 Jahr
12.886
+1.131
9.62%
1 Jan 1964 Jahr
12.993
+0.107
0.83%
1 Jan 1965 Jahr
12.241
-0.752
-5.79%
1 Jan 1966 Jahr
11.135
-1.107
-9.04%
1 Jan 1967 Jahr
10.12
-1.015
-9.12%
1 Jan 1968 Jahr
9.353
-0.766
-7.57%
1 Jan 1969 Jahr
8.714
-0.639
-6.84%
1 Jan 1970 Jahr
8.212
-0.502
-5.76%
1 Jan 1971 Jahr
7.803
-0.41
-4.99%
1 Jan 1972 Jahr
7.412
-0.391
-5.01%
1 Jan 1973 Jahr
7.031
-0.381
-5.14%
1 Jan 1974 Jahr
6.701
-0.33
-4.69%
1 Jan 1975 Jahr
6.42
-0.281
-4.2%
1 Jan 1976 Jahr
6.172
-0.247
-3.85%
1 Jan 1977 Jahr
5.935
-0.237
-3.84%
1 Jan 1978 Jahr
5.704
-0.231
-3.89%
1 Jan 1979 Jahr
5.491
-0.213
-3.74%
1 Jan 1980 Jahr
5.294
-0.197
-3.58%
1 Jan 1981 Jahr
5.106
-0.188
-3.55%
1 Jan 1982 Jahr
4.798
-0.308
-6.04%
1 Jan 1983 Jahr
4.475
-0.323
-6.73%
1 Jan 1984 Jahr
4.339
-0.136
-3.05%
1 Jan 1985 Jahr
4.422
+0.083
1.92%
1 Jan 1986 Jahr
4.563
+0.141
3.19%
1 Jan 1987 Jahr
4.94
+0.377
8.27%
1 Jan 1988 Jahr
5.066
+0.126
2.55%
1 Jan 1989 Jahr
4.321
-0.745
-14.71%
1 Jan 1990 Jahr
2.554
-1.768
-40.91%
1 Jan 1991 Jahr
0.213
-2.34
-91.64%
1 Jan 1992 Jahr
-2.544
-2.758
-1.29 Tsnd.%
1 Jan 1997 Jahr
0.053
+2.598
-102.1%
1 Jan 1998 Jahr
2.909
+2.856
5.34 Tsnd.%
1 Jan 1999 Jahr
4.635
+1.725
59.31%
1 Jan 2000 Jahr
4.803
+0.168
3.64%
1 Jan 2001 Jahr
4.036
-0.767
-15.98%
1 Jan 2002 Jahr
3.09
-0.946
-23.43%
1 Jan 2003 Jahr
2.589
-0.501
-16.22%
1 Jan 2004 Jahr
2.599
+0.01
0.4%
1 Jan 2005 Jahr
3.301
+0.702
27.01%
1 Jan 2006 Jahr
4.392
+1.09
33.03%
1 Jan 2007 Jahr
5.413
+1.021
23.24%
1 Jan 2008 Jahr
6.053
+0.64
11.83%
1 Jan 2009 Jahr
6.36
+0.307
5.08%
1 Jan 2010 Jahr
6.301
-0.059
-0.92%
1 Jan 2011 Jahr
6.002
-0.299
-4.75%
1 Jan 2012 Jahr
5.708
-0.294
-4.9%
1 Jan 2013 Jahr
5.42
-0.288
-5.05%
1 Jan 2014 Jahr
4.966
-0.454
-8.37%
1 Jan 2015 Jahr
4.341
-0.625
-12.59%
1 Jan 2016 Jahr
3.636
-0.704
-16.23%
Bewertung der Länder gemäß mit laufender Statistik nach Jahren


Kommentare: