29
/de/
de
AIzaSyAYiBZKx7MnpbEhh9jyipgxe19OcubqV5w
April 1, 2024
243024
Slovenia
SVN
true
2
1
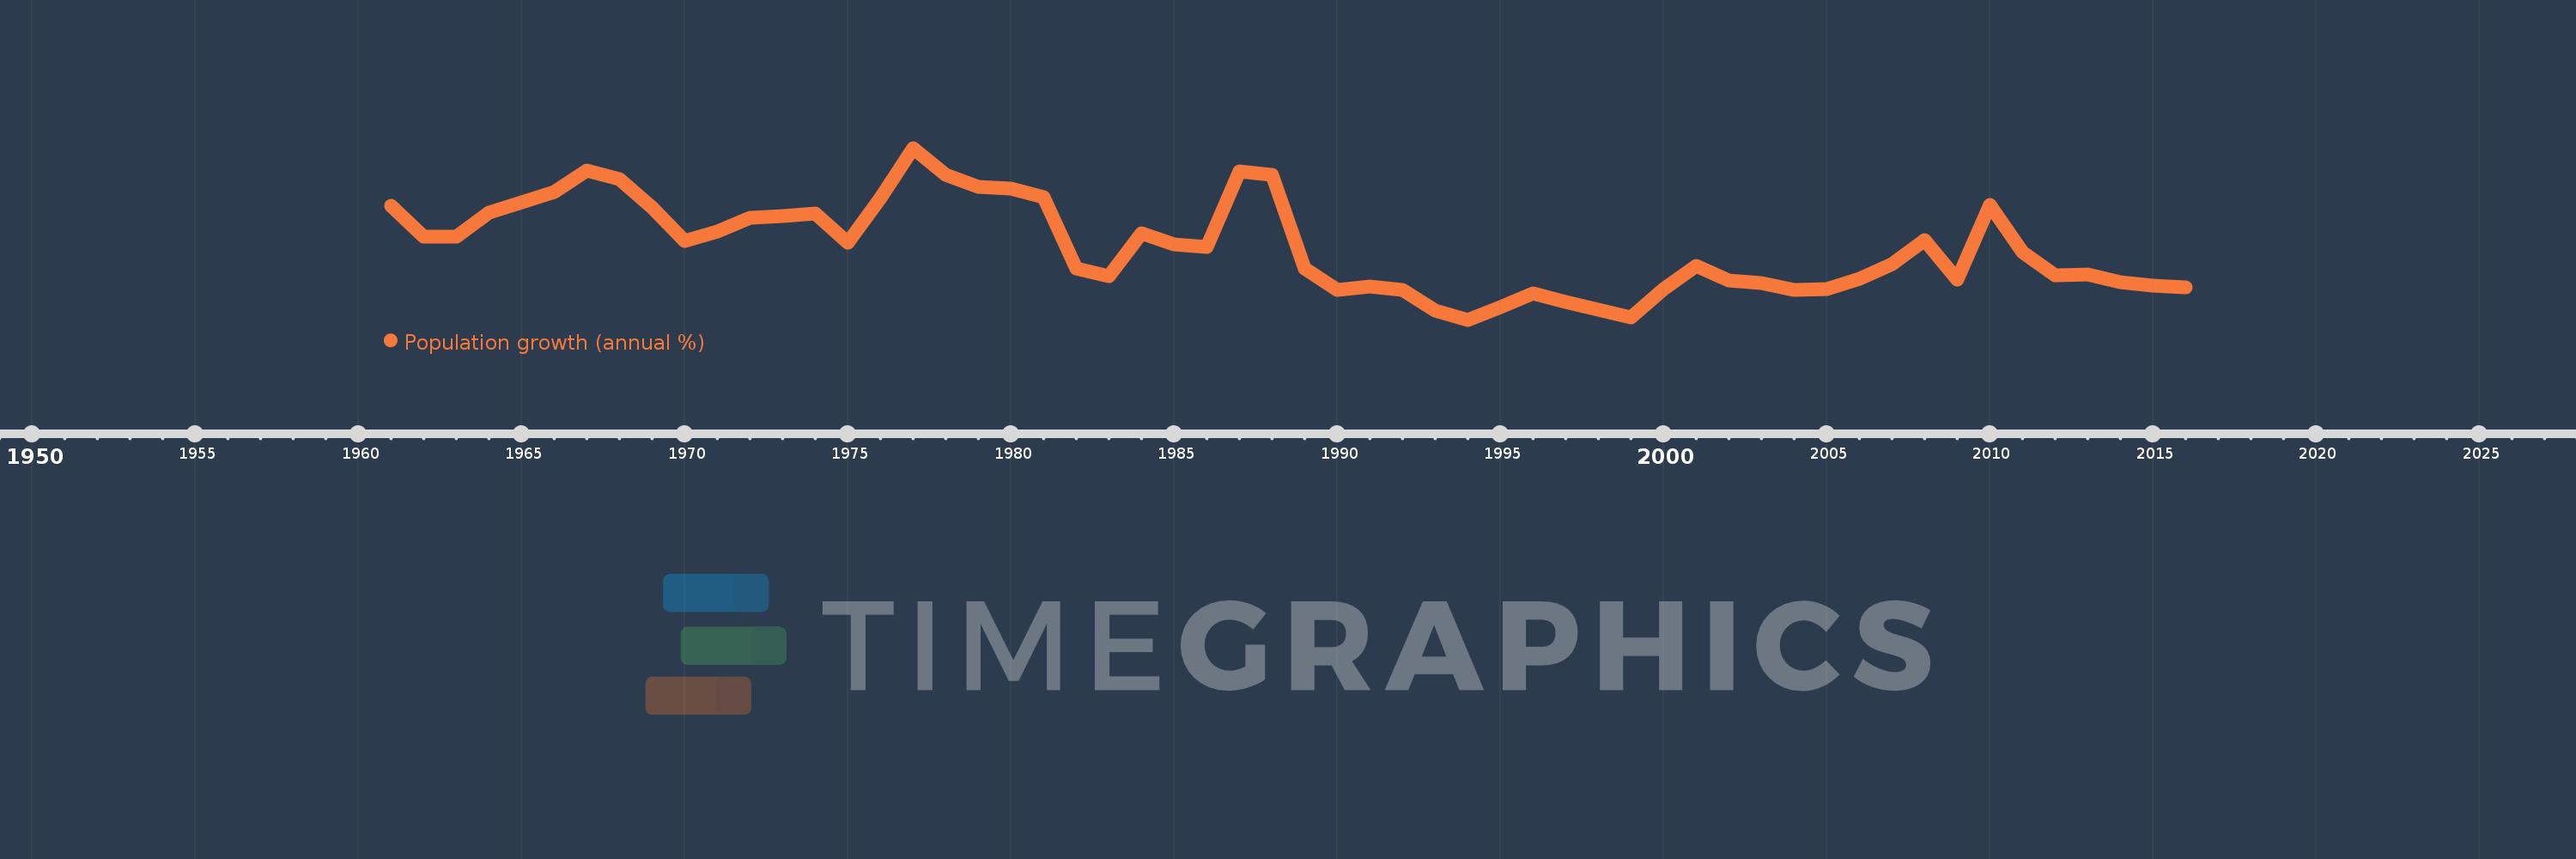
Population growth (annual %)
2016,2015,2014,2013,2012,2011,2010,2009,2008,2007,2006,2005,2004,2003,2002,2001,2000,1999,1998,1997,1996,1995,1994,1993,1992,1991,1990,1989,1988,1987,1986,1985,1984,1983,1982,1981,1980,1979,1978,1977,1976,1975,1974,1973,1972,1971,1970,1969,1968,1967,1966,1965,1964,1963,1962,1961
Diese Statistik in anderen Ländern:
AfghanistanAlbaniaAlgeriaAmerican SamoaAndorraAngolaAntigua and BarbudaArab WorldArgentinaArmeniaArubaAustraliaAustriaAzerbaijanBahamas, TheBahrainBangladeshBarbadosBelarusBelgiumBelizeBeninBermudaBhutanBoliviaBosnia and HerzegovinaBotswanaBrazilBritish Virgin IslandsBrunei DarussalamBulgariaBurkina FasoBurundiCabo VerdeCambodiaCameroonCanadaCaribbean small statesCayman IslandsCentral African RepublicCentral Europe and the BalticsChadChannel IslandsChileChinaColombiaComorosCongo, Dem. Rep.Congo, Rep.Costa RicaCote d'IvoireCroatiaCubaCuracaoCyprusCzech RepublicDenmarkDjiboutiDominicaDominican RepublicEarly-demographic dividendEast Asia & PacificEast Asia & Pacific (excluding high income)East Asia & Pacific (IDA & IBRD countries)EcuadorEgypt, Arab Rep.El SalvadorEquatorial GuineaEritreaEstoniaEthiopiaEuro areaEurope & Central AsiaEurope & Central Asia (excluding high income)Europe & Central Asia (IDA & IBRD countries)European UnionFaroe IslandsFijiFinlandFragile and conflict affected situationsFranceFrench PolynesiaGabonGambia, TheGeorgiaGermanyGhanaGibraltarGreeceGreenlandGrenadaGuamGuatemalaGuineaGuinea-BissauGuyanaHaitiHeavily indebted poor countries (HIPC)High incomeHondurasHong Kong SAR, ChinaHungaryIBRD onlyIcelandIDA & IBRD totalIDA blendIDA onlyIDA totalIndiaIndonesiaIran, Islamic Rep.IraqIrelandIsle of ManIsraelItalyJamaicaJapanJordanKazakhstanKenyaKiribatiKorea, Dem. People’s Rep.Korea, Rep.KosovoKuwaitKyrgyz RepublicLao PDRLate-demographic dividendLatin America & Caribbean Latin America & Caribbean (excluding high income)Latin America & the Caribbean (IDA & IBRD countries)LatviaLeast developed countries: UN classificationLebanonLesothoLiberiaLibyaLiechtensteinLithuaniaLow & middle incomeLow incomeLower middle incomeLuxembourgMacao SAR, ChinaMacedonia, FYRMadagascarMalawiMalaysiaMaldivesMaliMaltaMarshall IslandsMauritaniaMauritiusMexicoMicronesia, Fed. Sts.Middle East & North AfricaMiddle East & North Africa (excluding high income)Middle East & North Africa (IDA & IBRD countries)Middle incomeMoldovaMonacoMongoliaMontenegroMoroccoMozambiqueMyanmarNamibiaNauruNepalNetherlandsNew CaledoniaNew ZealandNicaraguaNigerNigeriaNorth AmericaNorthern Mariana IslandsNorwayOECD membersOmanOther small statesPacific island small statesPakistanPalauPanamaPapua New GuineaParaguayPeruPhilippinesPolandPortugalPost-demographic dividendPre-demographic dividendPuerto RicoQatarRomaniaRussian FederationRwandaSamoaSan MarinoSao Tome and PrincipeSaudi ArabiaSenegalSerbiaSeychellesSierra LeoneSingaporeSint Maarten (Dutch part)Slovak RepublicSloveniaSmall statesSolomon IslandsSomaliaSouth AfricaSouth AsiaSouth Asia (IDA & IBRD)South SudanSpainSri LankaSt. Kitts and NevisSt. LuciaSt. Martin (French part)St. Vincent and the GrenadinesSub-Saharan Africa Sub-Saharan Africa (excluding high income)Sub-Saharan Africa (IDA & IBRD countries)SudanSurinameSwazilandSwedenSwitzerlandSyrian Arab RepublicTajikistanTanzaniaThailandTimor-LesteTogoTongaTrinidad and TobagoTunisiaTurkeyTurkmenistanTurks and Caicos IslandsTuvaluUgandaUkraineUnited Arab EmiratesUnited KingdomUnited StatesUpper middle incomeUruguayUzbekistanVanuatuVenezuela, RBVietnamVirgin Islands (U.S.)West Bank and GazaWorldYemen, Rep.ZambiaZimbabwe Zeitlinie:
Diese Zeitleiste vorliegt die Graphik ab 1961 J. bis 2016 J. Slovenia. Die Angaben bis 1960 J. sind nicht vorhanden. Die Zahl aktueller Beobachtungen nach Daten: 56.
Die Quelle (Bezeichnung):
Kennzahlen der Weltentwicklung
Die Quelle (Einrichtung):
Derived from total population. Population source: (1) United Nations Population Division. World Population Prospects, (2) United Nations Statistical Division. Population and Vital Statistics Report (various years), (3) Census reports and other statistical
Kategorien:
Climate Change, Health
Es wurde aktualisiert:
23 Apr 2017 Jahr
Kennzahlen der Wertänderungen vom Jahr zum Jahr
Minimum:
-0.238
1 Jan 1994 Jahr
Maximum:
1.476
1 Jan 1977 Jahr
Zum Datum der Beobachtung
Wert
Absolute Veränderung
Die Veränderung bezüglich dem vorherigen Wert
1 Jan 1961 Jahr
0.902
+0.902
0.0%
1 Jan 1962 Jahr
0.592
-0.31
-34.35%
1 Jan 1963 Jahr
0.595
+0.003
0.54%
1 Jan 1964 Jahr
0.827
+0.232
38.97%
1 Jan 1965 Jahr
0.932
+0.105
12.67%
1 Jan 1966 Jahr
1.039
+0.107
11.46%
1 Jan 1967 Jahr
1.25
+0.211
20.31%
1 Jan 1968 Jahr
1.168
-0.082
-6.55%
1 Jan 1969 Jahr
0.885
-0.283
-24.25%
1 Jan 1970 Jahr
0.546
-0.339
-38.33%
1 Jan 1971 Jahr
0.641
+0.095
17.41%
1 Jan 1972 Jahr
0.776
+0.136
21.17%
1 Jan 1973 Jahr
0.796
+0.02
2.57%
1 Jan 1974 Jahr
0.822
+0.026
3.23%
1 Jan 1975 Jahr
0.533
-0.289
-35.21%
1 Jan 1976 Jahr
0.978
+0.445
83.55%
1 Jan 1977 Jahr
1.476
+0.498
50.97%
1 Jan 1978 Jahr
1.208
-0.268
-18.13%
1 Jan 1979 Jahr
1.089
-0.119
-9.88%
1 Jan 1980 Jahr
1.071
-0.018
-1.66%
1 Jan 1981 Jahr
0.989
-0.082
-7.61%
1 Jan 1982 Jahr
0.274
-0.715
-72.31%
1 Jan 1983 Jahr
0.199
-0.075
-27.26%
1 Jan 1984 Jahr
0.626
+0.426
213.9%
1 Jan 1985 Jahr
0.51
-0.115
-18.43%
1 Jan 1986 Jahr
0.49
-0.02
-4.0%
1 Jan 1987 Jahr
1.245
+0.755
154.17%
1 Jan 1988 Jahr
1.204
-0.041
-3.29%
1 Jan 1989 Jahr
0.272
-0.932
-77.41%
1 Jan 1990 Jahr
0.058
-0.214
-78.73%
1 Jan 1991 Jahr
0.091
+0.033
56.59%
1 Jan 1992 Jahr
0.063
-0.027
-30.0%
1 Jan 1993 Jahr
-0.147
-0.21
-331.25%
1 Jan 1994 Jahr
-0.238
-0.092
62.44%
1 Jan 1995 Jahr
-0.116
+0.123
-51.45%
1 Jan 1996 Jahr
0.022
+0.137
-118.64%
1 Jan 1997 Jahr
-0.063
-0.084
-390.04%
1 Jan 1998 Jahr
-0.134
-0.072
115.0%
1 Jan 1999 Jahr
-0.218
-0.084
62.22%
1 Jan 2000 Jahr
0.071
+0.29
-132.75%
1 Jan 2001 Jahr
0.296
+0.225
314.49%
1 Jan 2002 Jahr
0.157
-0.139
-46.8%
1 Jan 2003 Jahr
0.124
-0.034
-21.32%
1 Jan 2004 Jahr
0.06
-0.064
-51.34%
1 Jan 2005 Jahr
0.064
+0.004
6.25%
1 Jan 2006 Jahr
0.173
+0.109
170.36%
1 Jan 2007 Jahr
0.319
+0.146
84.24%
1 Jan 2008 Jahr
0.559
+0.24
75.24%
1 Jan 2009 Jahr
0.158
-0.401
-71.72%
1 Jan 2010 Jahr
0.904
+0.746
471.56%
1 Jan 2011 Jahr
0.436
-0.468
-51.75%
1 Jan 2012 Jahr
0.208
-0.228
-52.36%
1 Jan 2013 Jahr
0.21
+0.002
1.1%
1 Jan 2014 Jahr
0.136
-0.074
-35.38%
1 Jan 2015 Jahr
0.098
-0.037
-27.54%
1 Jan 2016 Jahr
0.087
-0.012
-11.87%
Bewertung der Länder gemäß mit laufender Statistik nach Jahren


Kommentare: