29
/de/
de
AIzaSyAYiBZKx7MnpbEhh9jyipgxe19OcubqV5w
April 1, 2024
62875
World
WLD
false
2
1
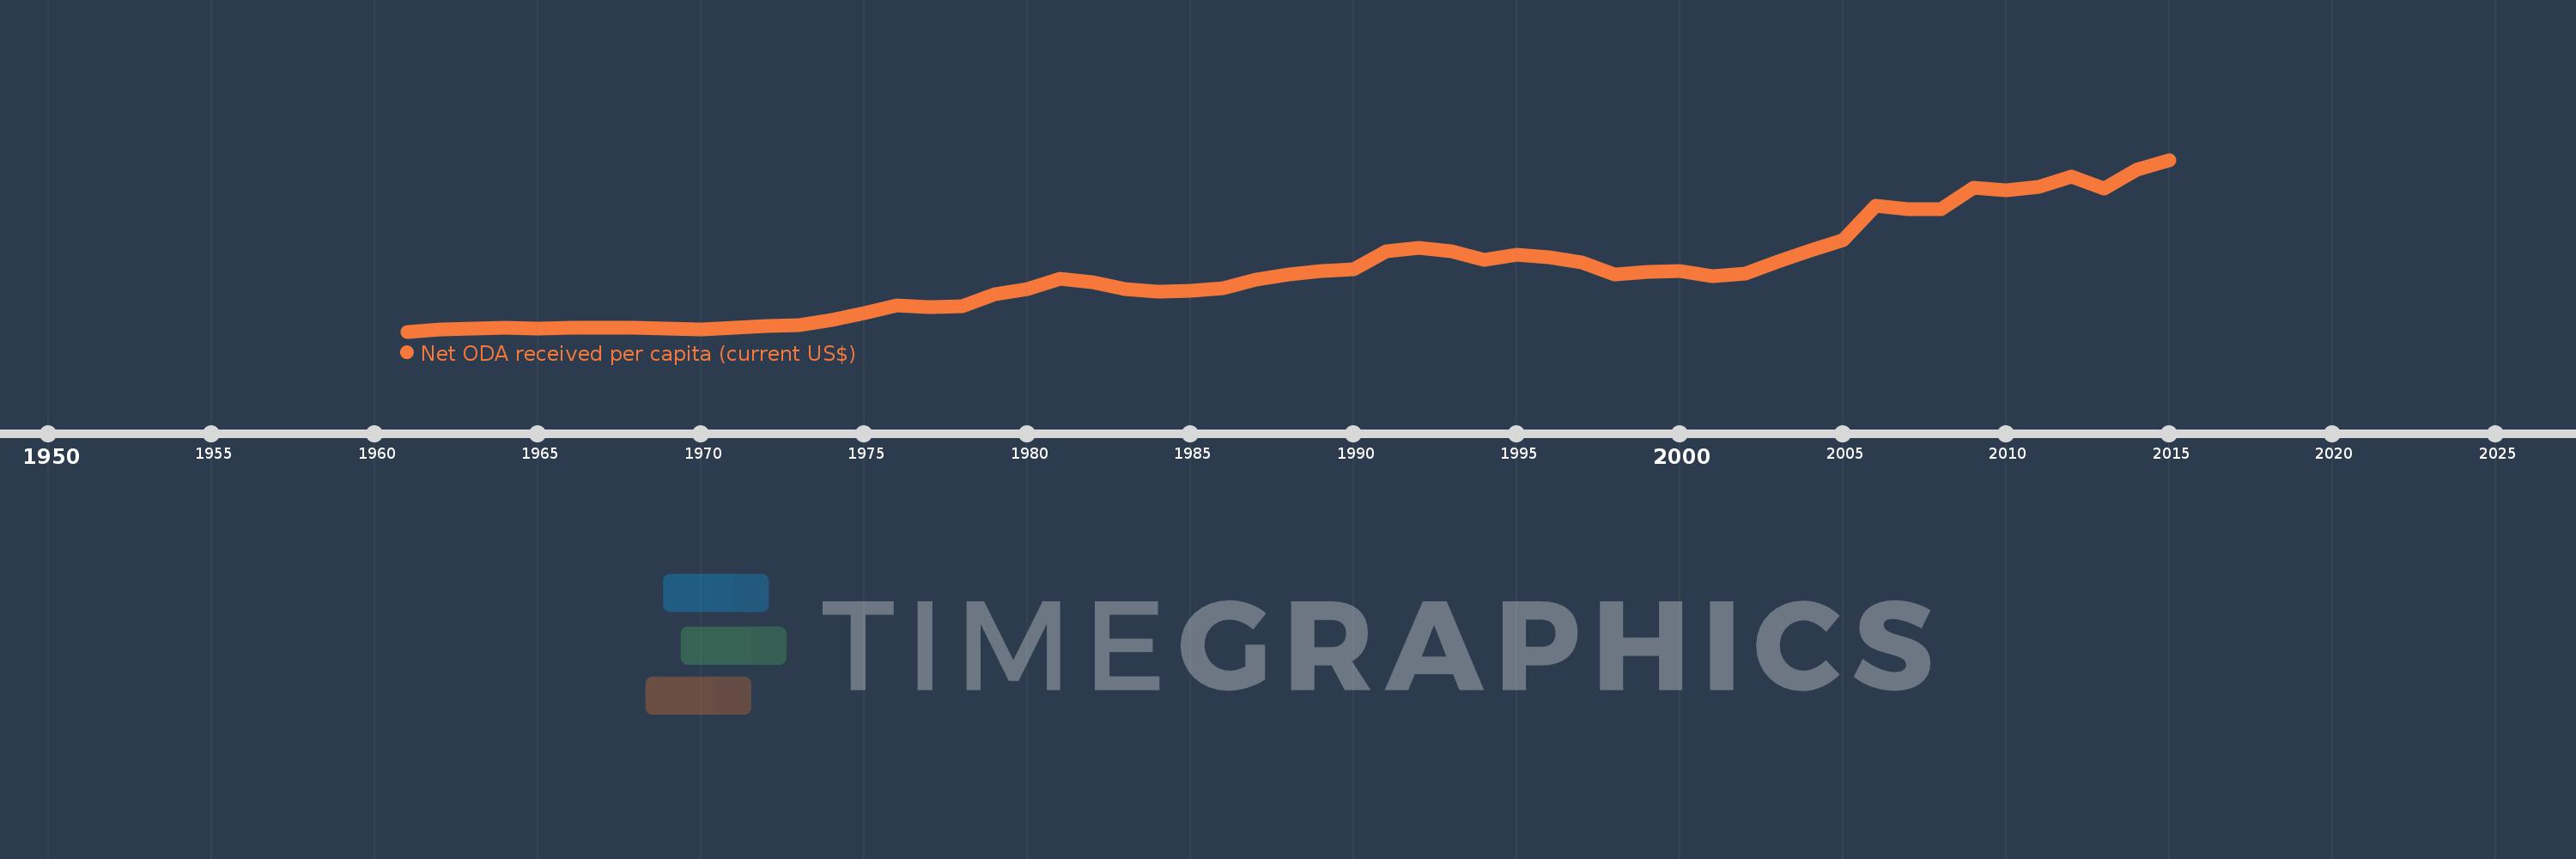
Net ODA received per capita (current US$)
2015,2014,2013,2012,2011,2010,2009,2008,2007,2006,2005,2004,2003,2002,2001,2000,1999,1998,1997,1996,1995,1994,1993,1992,1991,1990,1989,1988,1987,1986,1985,1984,1983,1982,1981,1980,1979,1978,1977,1976,1975,1974,1973,1972,1971,1970,1969,1968,1967,1966,1965,1964,1963,1962,1961
Diese Statistik in anderen Ländern:
AfghanistanAlbaniaAlgeriaAngolaAntigua and BarbudaArab WorldArgentinaArmeniaArubaAzerbaijanBahamas, TheBahrainBangladeshBarbadosBelarusBelizeBeninBermudaBhutanBoliviaBosnia and HerzegovinaBotswanaBrazilBritish Virgin IslandsBrunei DarussalamBurkina FasoBurundiCabo VerdeCambodiaCameroonCaribbean small statesCayman IslandsCentral African RepublicCentral Europe and the BalticsChadChileChinaColombiaComorosCongo, Dem. Rep.Congo, Rep.Costa RicaCote d'IvoireCroatiaCubaCyprusDjiboutiDominicaDominican RepublicEast Asia & PacificEast Asia & Pacific (excluding high income)East Asia & Pacific (IDA & IBRD countries)EcuadorEgypt, Arab Rep.El SalvadorEquatorial GuineaEritreaEthiopiaEuro areaEurope & Central AsiaEurope & Central Asia (excluding high income)Europe & Central Asia (IDA & IBRD countries)European UnionFijiFragile and conflict affected situationsFrench PolynesiaGabonGambia, TheGeorgiaGhanaGibraltarGrenadaGuatemalaGuineaGuinea-BissauGuyanaHaitiHeavily indebted poor countries (HIPC)High incomeHondurasHong Kong SAR, ChinaIBRD onlyIDA & IBRD totalIDA blendIDA onlyIDA totalIndiaIndonesiaIran, Islamic Rep.IraqIsraelJamaicaJordanKazakhstanKenyaKiribatiKorea, Dem. People’s Rep.Korea, Rep.KosovoKuwaitKyrgyz RepublicLao PDRLatin America & Caribbean Latin America & Caribbean (excluding high income)Latin America & the Caribbean (IDA & IBRD countries)Least developed countries: UN classificationLebanonLesothoLiberiaLibyaLow & middle incomeLow incomeLower middle incomeMacao SAR, ChinaMacedonia, FYRMadagascarMalawiMalaysiaMaldivesMaliMaltaMarshall IslandsMauritaniaMauritiusMexicoMicronesia, Fed. Sts.Middle East & North AfricaMiddle East & North Africa (excluding high income)Middle East & North Africa (IDA & IBRD countries)Middle incomeMoldovaMongoliaMontenegroMoroccoMozambiqueMyanmarNamibiaNauruNepalNew CaledoniaNicaraguaNigerNigeriaNorth AmericaNorthern Mariana IslandsOECD membersOmanOther small statesPacific island small statesPakistanPalauPanamaPapua New GuineaParaguayPeruPhilippinesQatarRwandaSamoaSao Tome and PrincipeSaudi ArabiaSenegalSerbiaSeychellesSierra LeoneSingaporeSloveniaSmall statesSolomon IslandsSomaliaSouth AfricaSouth AsiaSouth Asia (IDA & IBRD)South SudanSri LankaSt. Kitts and NevisSt. LuciaSt. Vincent and the GrenadinesSub-Saharan Africa Sub-Saharan Africa (excluding high income)Sub-Saharan Africa (IDA & IBRD countries)SudanSurinameSwazilandSyrian Arab RepublicTajikistanTanzaniaThailandTimor-LesteTogoTongaTrinidad and TobagoTunisiaTurkeyTurkmenistanTurks and Caicos IslandsTuvaluUgandaUkraineUnited Arab EmiratesUpper middle incomeUruguayUzbekistanVanuatuVenezuela, RBVietnamWest Bank and GazaWorldYemen, Rep.ZambiaZimbabwe Zeitlinie:
Diese Zeitleiste vorliegt die Graphik ab 1961 J. bis 2015 J. World. Die Angaben bis 1960 J. sind nicht vorhanden. Die Zahl aktueller Beobachtungen nach Daten: 55.
Die Quelle (Bezeichnung):
Kennzahlen der Weltentwicklung
Die Quelle (Einrichtung):
Development Assistance Committee of the Organisation for Economic Co-operation and Development, Geographical Distribution of Financial Flows to Developing Countries, Development Co-operation Report, and International Development Statistics database. Data are available online at: www.oecd.org/dac/stats/idsonline. World Bank population estimates are used for the denominator.
Kategorien:
Aid Effectiveness, Economy & Growth, External Debt
Es wurde aktualisiert:
23 Apr 2017 Jahr
Kennzahlen der Wertänderungen vom Jahr zum Jahr
Minimum:
1.402
1 Jan 1961 Jahr
Maximum:
22.184
1 Jan 2015 Jahr
Zum Datum der Beobachtung
Wert
Absolute Veränderung
Die Veränderung bezüglich dem vorherigen Wert
1 Jan 1961 Jahr
1.402
+1.402
0.0%
1 Jan 1962 Jahr
1.697
+0.295
21.04%
1 Jan 1963 Jahr
1.738
+0.042
2.46%
1 Jan 1964 Jahr
1.867
+0.128
7.38%
1 Jan 1965 Jahr
1.79
-0.076
-4.1%
1 Jan 1966 Jahr
1.877
+0.087
4.83%
1 Jan 1967 Jahr
1.889
+0.012
0.64%
1 Jan 1968 Jahr
1.911
+0.022
1.16%
1 Jan 1969 Jahr
1.783
-0.128
-6.7%
1 Jan 1970 Jahr
1.71
-0.073
-4.07%
1 Jan 1971 Jahr
1.855
+0.145
8.46%
1 Jan 1972 Jahr
2.063
+0.208
11.21%
1 Jan 1973 Jahr
2.147
+0.084
4.09%
1 Jan 1974 Jahr
2.791
+0.643
29.96%
1 Jan 1975 Jahr
3.667
+0.876
31.4%
1 Jan 1976 Jahr
4.621
+0.954
26.02%
1 Jan 1977 Jahr
4.374
-0.247
-5.35%
1 Jan 1978 Jahr
4.498
+0.124
2.84%
1 Jan 1979 Jahr
5.923
+1.425
31.67%
1 Jan 1980 Jahr
6.586
+0.664
11.2%
1 Jan 1981 Jahr
7.779
+1.193
18.11%
1 Jan 1982 Jahr
7.369
-0.41
-5.27%
1 Jan 1983 Jahr
6.59
-0.779
-10.58%
1 Jan 1984 Jahr
6.226
-0.364
-5.52%
1 Jan 1985 Jahr
6.36
+0.134
2.16%
1 Jan 1986 Jahr
6.657
+0.297
4.67%
1 Jan 1987 Jahr
7.65
+0.994
14.93%
1 Jan 1988 Jahr
8.29
+0.64
8.36%
1 Jan 1989 Jahr
8.75
+0.461
5.56%
1 Jan 1990 Jahr
8.927
+0.176
2.01%
1 Jan 1991 Jahr
11.069
+2.143
24.0%
1 Jan 1992 Jahr
11.507
+0.438
3.95%
1 Jan 1993 Jahr
11.125
-0.382
-3.32%
1 Jan 1994 Jahr
10.098
-1.026
-9.23%
1 Jan 1995 Jahr
10.686
+0.588
5.82%
1 Jan 1996 Jahr
10.347
-0.339
-3.18%
1 Jan 1997 Jahr
9.721
-0.626
-6.05%
1 Jan 1998 Jahr
8.336
-1.385
-14.25%
1 Jan 1999 Jahr
8.675
+0.339
4.07%
1 Jan 2000 Jahr
8.764
+0.089
1.03%
1 Jan 2001 Jahr
8.123
-0.641
-7.32%
1 Jan 2002 Jahr
8.437
+0.314
3.87%
1 Jan 2003 Jahr
9.867
+1.43
16.95%
1 Jan 2004 Jahr
11.265
+1.399
14.18%
1 Jan 2005 Jahr
12.421
+1.156
10.26%
1 Jan 2006 Jahr
16.649
+4.228
34.04%
1 Jan 2007 Jahr
16.226
-0.423
-2.54%
1 Jan 2008 Jahr
16.19
-0.036
-0.22%
1 Jan 2009 Jahr
18.857
+2.667
16.48%
1 Jan 2010 Jahr
18.519
-0.338
-1.79%
1 Jan 2011 Jahr
18.882
+0.363
1.96%
1 Jan 2012 Jahr
20.203
+1.32
6.99%
1 Jan 2013 Jahr
18.723
-1.48
-7.32%
1 Jan 2014 Jahr
21.014
+2.291
12.24%
1 Jan 2015 Jahr
22.184
+1.17
5.57%
Bewertung der Länder gemäß mit laufender Statistik nach Jahren


Kommentare: