29
/de/
de
AIzaSyAYiBZKx7MnpbEhh9jyipgxe19OcubqV5w
April 1, 2024
203307
Mozambique
MOZ
true
2
1
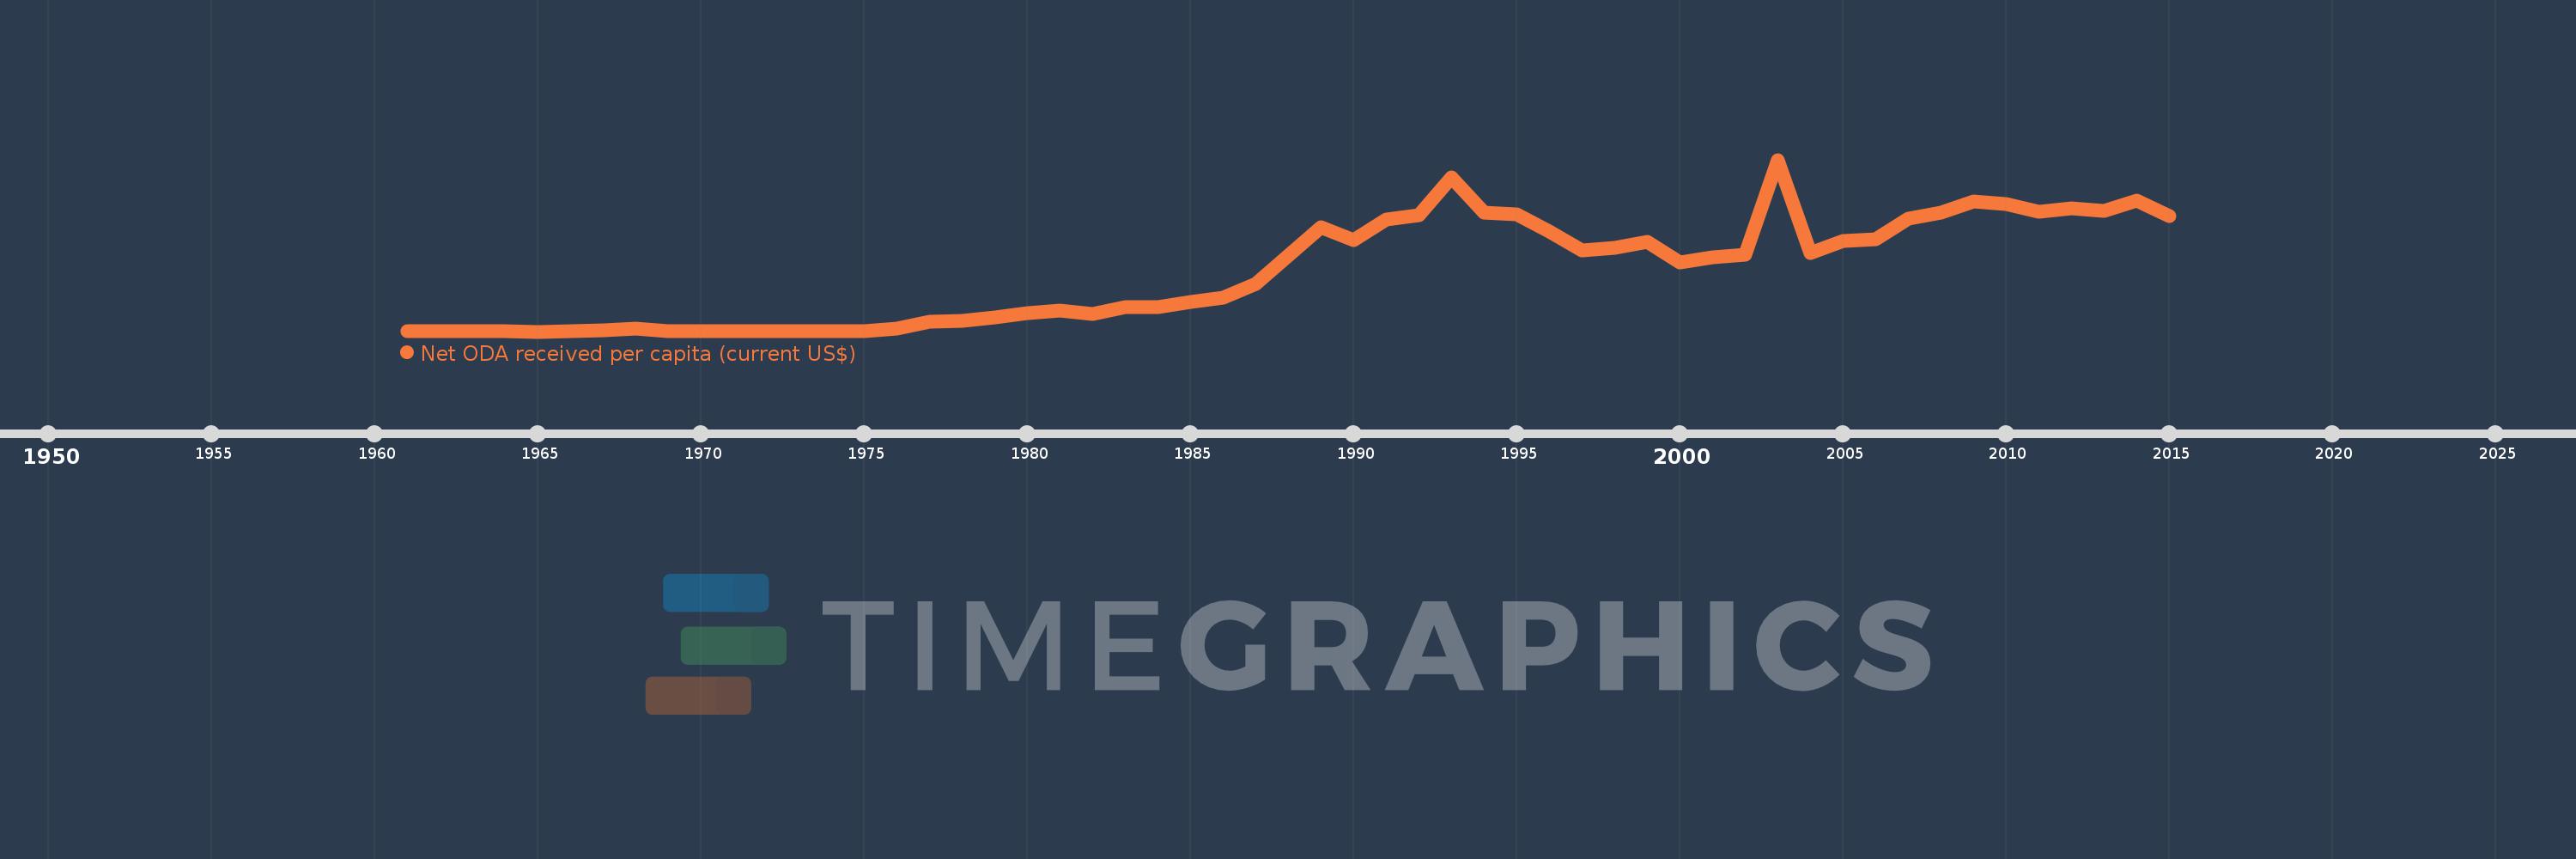
Net ODA received per capita (current US$)
2015,2014,2013,2012,2011,2010,2009,2008,2007,2006,2005,2004,2003,2002,2001,2000,1999,1998,1997,1996,1995,1994,1993,1992,1991,1990,1989,1988,1987,1986,1985,1984,1983,1982,1981,1980,1979,1978,1977,1976,1975,1974,1973,1972,1971,1970,1969,1968,1967,1965,1964,1963,1962,1961
Diese Statistik in anderen Ländern:
AfghanistanAlbaniaAlgeriaAngolaAntigua and BarbudaArab WorldArgentinaArmeniaArubaAzerbaijanBahamas, TheBahrainBangladeshBarbadosBelarusBelizeBeninBermudaBhutanBoliviaBosnia and HerzegovinaBotswanaBrazilBritish Virgin IslandsBrunei DarussalamBurkina FasoBurundiCabo VerdeCambodiaCameroonCaribbean small statesCayman IslandsCentral African RepublicCentral Europe and the BalticsChadChileChinaColombiaComorosCongo, Dem. Rep.Congo, Rep.Costa RicaCote d'IvoireCroatiaCubaCyprusDjiboutiDominicaDominican RepublicEast Asia & PacificEast Asia & Pacific (excluding high income)East Asia & Pacific (IDA & IBRD countries)EcuadorEgypt, Arab Rep.El SalvadorEquatorial GuineaEritreaEthiopiaEuro areaEurope & Central AsiaEurope & Central Asia (excluding high income)Europe & Central Asia (IDA & IBRD countries)European UnionFijiFragile and conflict affected situationsFrench PolynesiaGabonGambia, TheGeorgiaGhanaGibraltarGrenadaGuatemalaGuineaGuinea-BissauGuyanaHaitiHeavily indebted poor countries (HIPC)High incomeHondurasHong Kong SAR, ChinaIBRD onlyIDA & IBRD totalIDA blendIDA onlyIDA totalIndiaIndonesiaIran, Islamic Rep.IraqIsraelJamaicaJordanKazakhstanKenyaKiribatiKorea, Dem. People’s Rep.Korea, Rep.KosovoKuwaitKyrgyz RepublicLao PDRLatin America & Caribbean Latin America & Caribbean (excluding high income)Latin America & the Caribbean (IDA & IBRD countries)Least developed countries: UN classificationLebanonLesothoLiberiaLibyaLow & middle incomeLow incomeLower middle incomeMacao SAR, ChinaMacedonia, FYRMadagascarMalawiMalaysiaMaldivesMaliMaltaMarshall IslandsMauritaniaMauritiusMexicoMicronesia, Fed. Sts.Middle East & North AfricaMiddle East & North Africa (excluding high income)Middle East & North Africa (IDA & IBRD countries)Middle incomeMoldovaMongoliaMontenegroMoroccoMozambiqueMyanmarNamibiaNauruNepalNew CaledoniaNicaraguaNigerNigeriaNorth AmericaNorthern Mariana IslandsOECD membersOmanOther small statesPacific island small statesPakistanPalauPanamaPapua New GuineaParaguayPeruPhilippinesQatarRwandaSamoaSao Tome and PrincipeSaudi ArabiaSenegalSerbiaSeychellesSierra LeoneSingaporeSloveniaSmall statesSolomon IslandsSomaliaSouth AfricaSouth AsiaSouth Asia (IDA & IBRD)South SudanSri LankaSt. Kitts and NevisSt. LuciaSt. Vincent and the GrenadinesSub-Saharan Africa Sub-Saharan Africa (excluding high income)Sub-Saharan Africa (IDA & IBRD countries)SudanSurinameSwazilandSyrian Arab RepublicTajikistanTanzaniaThailandTimor-LesteTogoTongaTrinidad and TobagoTunisiaTurkeyTurkmenistanTurks and Caicos IslandsTuvaluUgandaUkraineUnited Arab EmiratesUpper middle incomeUruguayUzbekistanVanuatuVenezuela, RBVietnamWest Bank and GazaWorldYemen, Rep.ZambiaZimbabwe Zeitlinie:
Diese Zeitleiste vorliegt die Graphik ab 1961 J. bis 2015 J. Mozambique. Die Angaben bis 1960 J. sind nicht vorhanden. Die Zahl aktueller Beobachtungen nach Daten: 54.
Die Quelle (Bezeichnung):
Kennzahlen der Weltentwicklung
Die Quelle (Einrichtung):
Development Assistance Committee of the Organisation for Economic Co-operation and Development, Geographical Distribution of Financial Flows to Developing Countries, Development Co-operation Report, and International Development Statistics database. Data are available online at: www.oecd.org/dac/stats/idsonline. World Bank population estimates are used for the denominator.
Kategorien:
Aid Effectiveness, Economy & Growth, External Debt
Es wurde aktualisiert:
23 Apr 2017 Jahr
Kennzahlen der Wertänderungen vom Jahr zum Jahr
Minimum:
-0.005
1 Jan 1965 Jahr
Maximum:
114.699
1 Jan 2003 Jahr
Zum Datum der Beobachtung
Wert
Absolute Veränderung
Die Veränderung bezüglich dem vorherigen Wert
1 Jan 1961 Jahr
0.003
+0.003
0.0%
1 Jan 1962 Jahr
0.47
+0.467
17.5 Tsnd.%
1 Jan 1963 Jahr
0.012
-0.458
-97.54%
1 Jan 1964 Jahr
0.021
+0.01
85.04%
1 Jan 1965 Jahr
-0.005
-0.026
-123.04%
1 Jan 1967 Jahr
0.808
+0.812
-16.51 Tsnd.%
1 Jan 1968 Jahr
2.08
+1.272
157.56%
1 Jan 1969 Jahr
0.002
-2.078
-99.89%
1 Jan 1970 Jahr
0.003
+0.001
46.72%
1 Jan 1971 Jahr
0.009
+0.005
160.81%
1 Jan 1972 Jahr
0.013
+0.004
46.72%
1 Jan 1973 Jahr
0.013
+0.001
5.97%
1 Jan 1974 Jahr
0.011
-0.002
-17.28%
1 Jan 1975 Jahr
0.068
+0.057
512.42%
1 Jan 1976 Jahr
1.954
+1.886
2.77 Tsnd.%
1 Jan 1977 Jahr
6.534
+4.58
234.4%
1 Jan 1978 Jahr
7.253
+0.72
11.01%
1 Jan 1979 Jahr
9.194
+1.941
26.76%
1 Jan 1980 Jahr
12.368
+3.173
34.52%
1 Jan 1981 Jahr
13.996
+1.628
13.16%
1 Jan 1982 Jahr
11.469
-2.527
-18.05%
1 Jan 1983 Jahr
16.345
+4.876
42.52%
1 Jan 1984 Jahr
16.215
-0.131
-0.8%
1 Jan 1985 Jahr
19.611
+3.396
20.95%
1 Jan 1986 Jahr
22.567
+2.956
15.07%
1 Jan 1987 Jahr
31.929
+9.362
41.49%
1 Jan 1988 Jahr
50.615
+18.686
58.53%
1 Jan 1989 Jahr
69.84
+19.225
37.98%
1 Jan 1990 Jahr
61.068
-8.772
-12.56%
1 Jan 1991 Jahr
74.597
+13.529
22.15%
1 Jan 1992 Jahr
77.632
+3.035
4.07%
1 Jan 1993 Jahr
102.766
+25.133
32.38%
1 Jan 1994 Jahr
79.557
-23.208
-22.58%
1 Jan 1995 Jahr
78.04
-1.517
-1.91%
1 Jan 1996 Jahr
66.762
-11.278
-14.45%
1 Jan 1997 Jahr
53.972
-12.79
-19.16%
1 Jan 1998 Jahr
56.134
+2.161
4.0%
1 Jan 1999 Jahr
60.044
+3.91
6.97%
1 Jan 2000 Jahr
46.051
-13.992
-23.3%
1 Jan 2001 Jahr
49.616
+3.565
7.74%
1 Jan 2002 Jahr
51.123
+1.507
3.04%
1 Jan 2003 Jahr
114.699
+63.576
124.36%
1 Jan 2004 Jahr
52.587
-62.112
-54.15%
1 Jan 2005 Jahr
60.559
+7.972
15.16%
1 Jan 2006 Jahr
61.399
+0.84
1.39%
1 Jan 2007 Jahr
75.412
+14.014
22.82%
1 Jan 2008 Jahr
79.453
+4.041
5.36%
1 Jan 2009 Jahr
86.819
+7.365
9.27%
1 Jan 2010 Jahr
85.099
-1.72
-1.98%
1 Jan 2011 Jahr
79.811
-5.288
-6.21%
1 Jan 2012 Jahr
82.539
+2.729
3.42%
1 Jan 2013 Jahr
80.597
-1.943
-2.35%
1 Jan 2014 Jahr
87.455
+6.858
8.51%
1 Jan 2015 Jahr
77.286
-10.169
-11.63%
Bewertung der Länder gemäß mit laufender Statistik nach Jahren


Kommentare: