29
/de/
de
AIzaSyAYiBZKx7MnpbEhh9jyipgxe19OcubqV5w
April 1, 2024
49317
Middle East & North Africa (excluding high income)
MNA
false
2
1
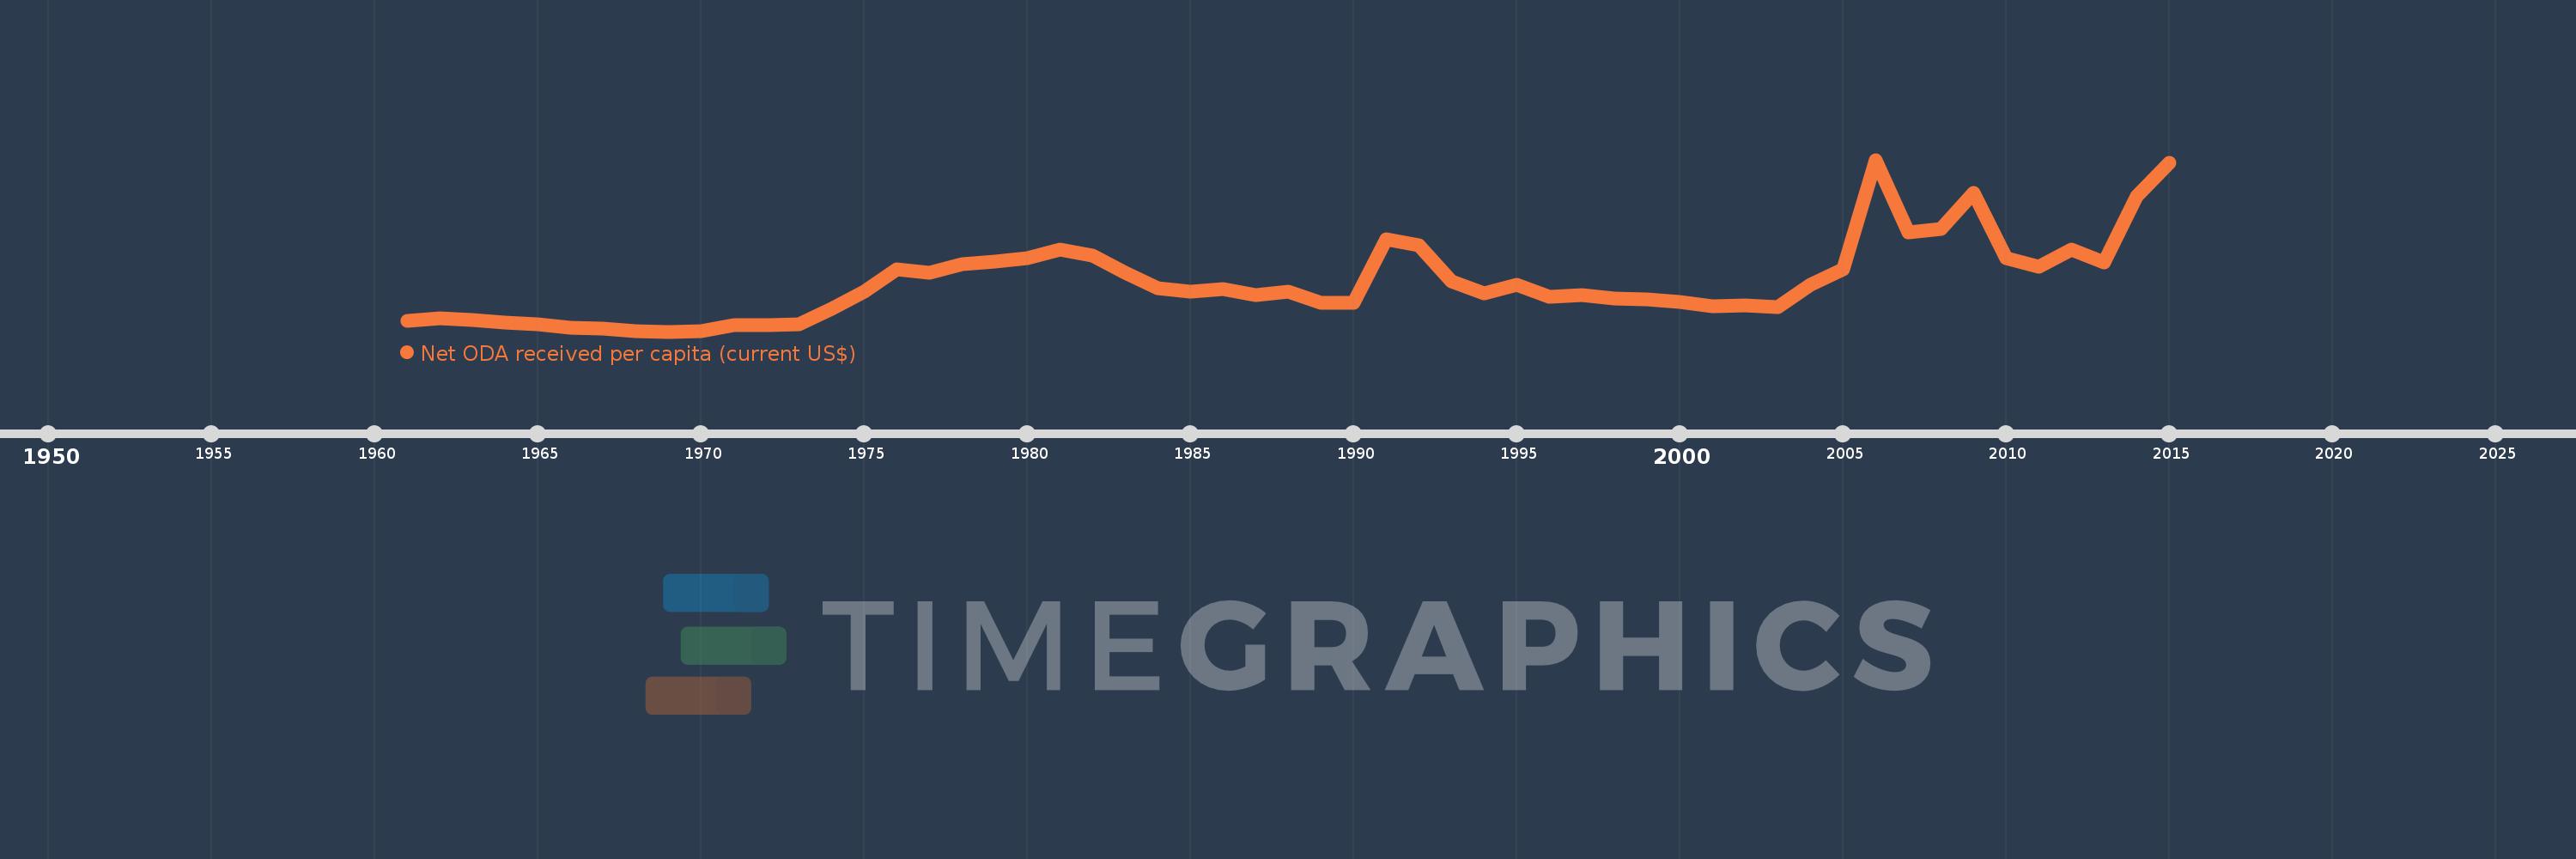
Net ODA received per capita (current US$)
2015,2014,2013,2012,2011,2010,2009,2008,2007,2006,2005,2004,2003,2002,2001,2000,1999,1998,1997,1996,1995,1994,1993,1992,1991,1990,1989,1988,1987,1986,1985,1984,1983,1982,1981,1980,1979,1978,1977,1976,1975,1974,1973,1972,1971,1970,1969,1968,1967,1966,1965,1964,1963,1962,1961
Diese Statistik in anderen Ländern:
AfghanistanAlbaniaAlgeriaAngolaAntigua and BarbudaArab WorldArgentinaArmeniaArubaAzerbaijanBahamas, TheBahrainBangladeshBarbadosBelarusBelizeBeninBermudaBhutanBoliviaBosnia and HerzegovinaBotswanaBrazilBritish Virgin IslandsBrunei DarussalamBurkina FasoBurundiCabo VerdeCambodiaCameroonCaribbean small statesCayman IslandsCentral African RepublicCentral Europe and the BalticsChadChileChinaColombiaComorosCongo, Dem. Rep.Congo, Rep.Costa RicaCote d'IvoireCroatiaCubaCyprusDjiboutiDominicaDominican RepublicEast Asia & PacificEast Asia & Pacific (excluding high income)East Asia & Pacific (IDA & IBRD countries)EcuadorEgypt, Arab Rep.El SalvadorEquatorial GuineaEritreaEthiopiaEuro areaEurope & Central AsiaEurope & Central Asia (excluding high income)Europe & Central Asia (IDA & IBRD countries)European UnionFijiFragile and conflict affected situationsFrench PolynesiaGabonGambia, TheGeorgiaGhanaGibraltarGrenadaGuatemalaGuineaGuinea-BissauGuyanaHaitiHeavily indebted poor countries (HIPC)High incomeHondurasHong Kong SAR, ChinaIBRD onlyIDA & IBRD totalIDA blendIDA onlyIDA totalIndiaIndonesiaIran, Islamic Rep.IraqIsraelJamaicaJordanKazakhstanKenyaKiribatiKorea, Dem. People’s Rep.Korea, Rep.KosovoKuwaitKyrgyz RepublicLao PDRLatin America & Caribbean Latin America & Caribbean (excluding high income)Latin America & the Caribbean (IDA & IBRD countries)Least developed countries: UN classificationLebanonLesothoLiberiaLibyaLow & middle incomeLow incomeLower middle incomeMacao SAR, ChinaMacedonia, FYRMadagascarMalawiMalaysiaMaldivesMaliMaltaMarshall IslandsMauritaniaMauritiusMexicoMicronesia, Fed. Sts.Middle East & North AfricaMiddle East & North Africa (excluding high income)Middle East & North Africa (IDA & IBRD countries)Middle incomeMoldovaMongoliaMontenegroMoroccoMozambiqueMyanmarNamibiaNauruNepalNew CaledoniaNicaraguaNigerNigeriaNorth AmericaNorthern Mariana IslandsOECD membersOmanOther small statesPacific island small statesPakistanPalauPanamaPapua New GuineaParaguayPeruPhilippinesQatarRwandaSamoaSao Tome and PrincipeSaudi ArabiaSenegalSerbiaSeychellesSierra LeoneSingaporeSloveniaSmall statesSolomon IslandsSomaliaSouth AfricaSouth AsiaSouth Asia (IDA & IBRD)South SudanSri LankaSt. Kitts and NevisSt. LuciaSt. Vincent and the GrenadinesSub-Saharan Africa Sub-Saharan Africa (excluding high income)Sub-Saharan Africa (IDA & IBRD countries)SudanSurinameSwazilandSyrian Arab RepublicTajikistanTanzaniaThailandTimor-LesteTogoTongaTrinidad and TobagoTunisiaTurkeyTurkmenistanTurks and Caicos IslandsTuvaluUgandaUkraineUnited Arab EmiratesUpper middle incomeUruguayUzbekistanVanuatuVenezuela, RBVietnamWest Bank and GazaWorldYemen, Rep.ZambiaZimbabwe Zeitlinie:
Diese Zeitleiste vorliegt die Graphik ab 1961 J. bis 2015 J. Middle East & North Africa (excluding high income). Die Angaben bis 1960 J. sind nicht vorhanden. Die Zahl aktueller Beobachtungen nach Daten: 55.
Die Quelle (Bezeichnung):
Kennzahlen der Weltentwicklung
Die Quelle (Einrichtung):
Development Assistance Committee of the Organisation for Economic Co-operation and Development, Geographical Distribution of Financial Flows to Developing Countries, Development Co-operation Report, and International Development Statistics database. Data are available online at: www.oecd.org/dac/stats/idsonline. World Bank population estimates are used for the denominator.
Kategorien:
Aid Effectiveness, Economy & Growth, External Debt
Es wurde aktualisiert:
23 Apr 2017 Jahr
Kennzahlen der Wertänderungen vom Jahr zum Jahr
Minimum:
3.48
1 Jan 1969 Jahr
Maximum:
92.91
1 Jan 2006 Jahr
Zum Datum der Beobachtung
Wert
Absolute Veränderung
Die Veränderung bezüglich dem vorherigen Wert
1 Jan 1961 Jahr
9.044
+9.044
0.0%
1 Jan 1962 Jahr
10.634
+1.59
17.58%
1 Jan 1963 Jahr
9.477
-1.157
-10.88%
1 Jan 1964 Jahr
8.136
-1.341
-14.15%
1 Jan 1965 Jahr
7.209
-0.927
-11.4%
1 Jan 1966 Jahr
5.585
-1.624
-22.52%
1 Jan 1967 Jahr
5.074
-0.511
-9.16%
1 Jan 1968 Jahr
3.743
-1.33
-26.22%
1 Jan 1969 Jahr
3.48
-0.263
-7.03%
1 Jan 1970 Jahr
3.749
+0.268
7.71%
1 Jan 1971 Jahr
7.022
+3.273
87.33%
1 Jan 1972 Jahr
6.714
-0.308
-4.39%
1 Jan 1973 Jahr
7.312
+0.598
8.91%
1 Jan 1974 Jahr
15.348
+8.036
109.89%
1 Jan 1975 Jahr
24.086
+8.738
56.93%
1 Jan 1976 Jahr
35.744
+11.658
48.4%
1 Jan 1977 Jahr
33.989
-1.755
-4.91%
1 Jan 1978 Jahr
38.74
+4.75
13.98%
1 Jan 1979 Jahr
39.707
+0.968
2.5%
1 Jan 1980 Jahr
41.848
+2.141
5.39%
1 Jan 1981 Jahr
46.334
+4.486
10.72%
1 Jan 1982 Jahr
43.066
-3.268
-7.05%
1 Jan 1983 Jahr
33.89
-9.176
-21.31%
1 Jan 1984 Jahr
25.931
-7.959
-23.48%
1 Jan 1985 Jahr
24.33
-1.601
-6.18%
1 Jan 1986 Jahr
25.411
+1.081
4.44%
1 Jan 1987 Jahr
22.489
-2.921
-11.5%
1 Jan 1988 Jahr
24.402
+1.913
8.51%
1 Jan 1989 Jahr
18.384
-6.018
-24.66%
1 Jan 1990 Jahr
18.265
-0.119
-0.64%
1 Jan 1991 Jahr
51.732
+33.466
183.22%
1 Jan 1992 Jahr
48.479
-3.253
-6.29%
1 Jan 1993 Jahr
29.818
-18.661
-38.49%
1 Jan 1994 Jahr
23.371
-6.447
-21.62%
1 Jan 1995 Jahr
27.961
+4.59
19.64%
1 Jan 1996 Jahr
21.707
-6.254
-22.37%
1 Jan 1997 Jahr
22.428
+0.721
3.32%
1 Jan 1998 Jahr
20.604
-1.824
-8.13%
1 Jan 1999 Jahr
20.226
-0.378
-1.83%
1 Jan 2000 Jahr
19.071
-1.155
-5.71%
1 Jan 2001 Jahr
16.63
-2.44
-12.8%
1 Jan 2002 Jahr
17.206
+0.576
3.46%
1 Jan 2003 Jahr
16.19
-1.016
-5.9%
1 Jan 2004 Jahr
27.891
+11.701
72.27%
1 Jan 2005 Jahr
35.792
+7.9
28.33%
1 Jan 2006 Jahr
92.91
+57.118
159.58%
1 Jan 2007 Jahr
55.321
-37.588
-40.46%
1 Jan 2008 Jahr
56.965
+1.644
2.97%
1 Jan 2009 Jahr
75.588
+18.623
32.69%
1 Jan 2010 Jahr
41.641
-33.947
-44.91%
1 Jan 2011 Jahr
37.05
-4.591
-11.03%
1 Jan 2012 Jahr
46.083
+9.033
24.38%
1 Jan 2013 Jahr
39.614
-6.469
-14.04%
1 Jan 2014 Jahr
73.803
+34.189
86.31%
1 Jan 2015 Jahr
91.497
+17.694
23.97%
Bewertung der Länder gemäß mit laufender Statistik nach Jahren


Kommentare: