29
/de/
de
AIzaSyAYiBZKx7MnpbEhh9jyipgxe19OcubqV5w
April 1, 2024
271595
Tuvalu
TUV
true
2
1
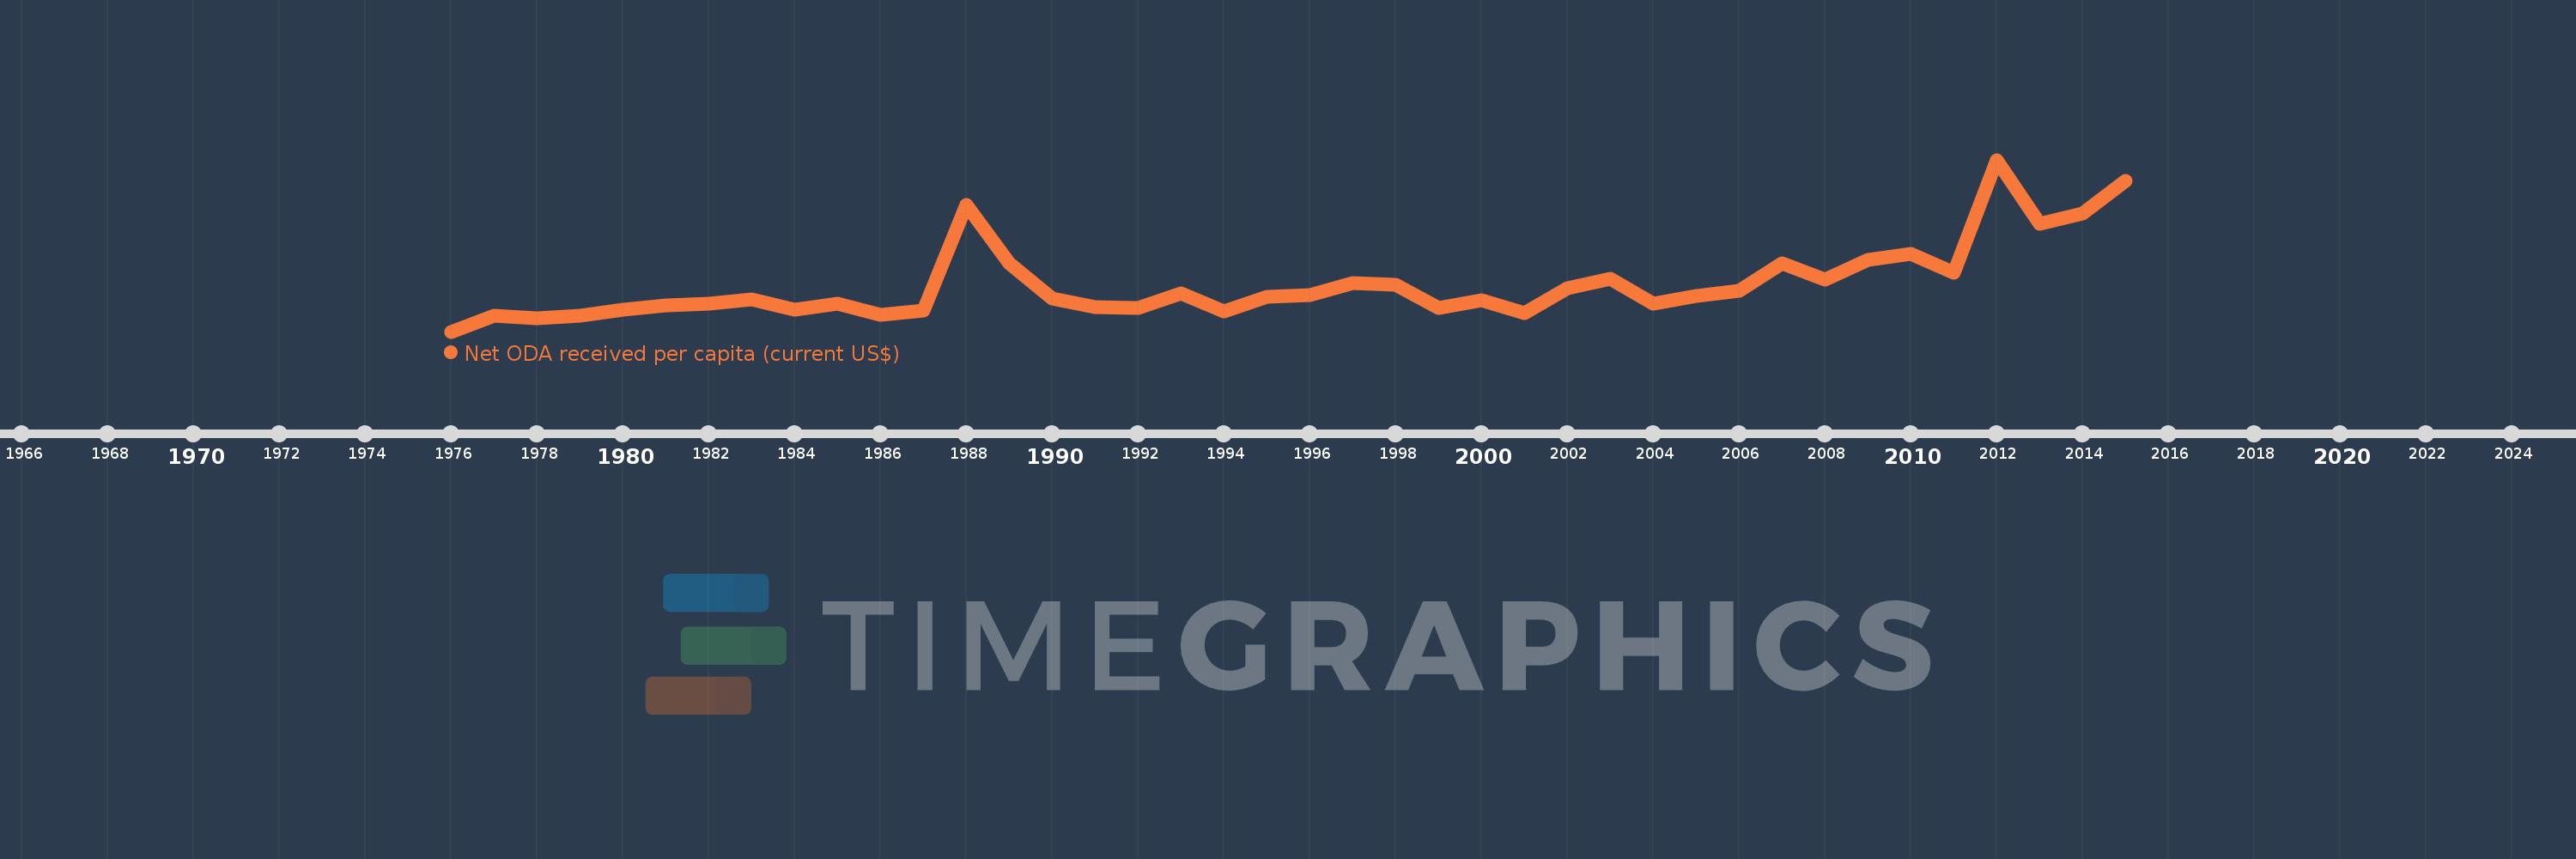
Net ODA received per capita (current US$)
2015,2014,2013,2012,2011,2010,2009,2008,2007,2006,2005,2004,2003,2002,2001,2000,1999,1998,1997,1996,1995,1994,1993,1992,1991,1990,1989,1988,1987,1986,1985,1984,1983,1982,1981,1980,1979,1978,1977,1976
Diese Statistik in anderen Ländern:
AfghanistanAlbaniaAlgeriaAngolaAntigua and BarbudaArab WorldArgentinaArmeniaArubaAzerbaijanBahamas, TheBahrainBangladeshBarbadosBelarusBelizeBeninBermudaBhutanBoliviaBosnia and HerzegovinaBotswanaBrazilBritish Virgin IslandsBrunei DarussalamBurkina FasoBurundiCabo VerdeCambodiaCameroonCaribbean small statesCayman IslandsCentral African RepublicCentral Europe and the BalticsChadChileChinaColombiaComorosCongo, Dem. Rep.Congo, Rep.Costa RicaCote d'IvoireCroatiaCubaCyprusDjiboutiDominicaDominican RepublicEast Asia & PacificEast Asia & Pacific (excluding high income)East Asia & Pacific (IDA & IBRD countries)EcuadorEgypt, Arab Rep.El SalvadorEquatorial GuineaEritreaEthiopiaEuro areaEurope & Central AsiaEurope & Central Asia (excluding high income)Europe & Central Asia (IDA & IBRD countries)European UnionFijiFragile and conflict affected situationsFrench PolynesiaGabonGambia, TheGeorgiaGhanaGibraltarGrenadaGuatemalaGuineaGuinea-BissauGuyanaHaitiHeavily indebted poor countries (HIPC)High incomeHondurasHong Kong SAR, ChinaIBRD onlyIDA & IBRD totalIDA blendIDA onlyIDA totalIndiaIndonesiaIran, Islamic Rep.IraqIsraelJamaicaJordanKazakhstanKenyaKiribatiKorea, Dem. People’s Rep.Korea, Rep.KosovoKuwaitKyrgyz RepublicLao PDRLatin America & Caribbean Latin America & Caribbean (excluding high income)Latin America & the Caribbean (IDA & IBRD countries)Least developed countries: UN classificationLebanonLesothoLiberiaLibyaLow & middle incomeLow incomeLower middle incomeMacao SAR, ChinaMacedonia, FYRMadagascarMalawiMalaysiaMaldivesMaliMaltaMarshall IslandsMauritaniaMauritiusMexicoMicronesia, Fed. Sts.Middle East & North AfricaMiddle East & North Africa (excluding high income)Middle East & North Africa (IDA & IBRD countries)Middle incomeMoldovaMongoliaMontenegroMoroccoMozambiqueMyanmarNamibiaNauruNepalNew CaledoniaNicaraguaNigerNigeriaNorth AmericaNorthern Mariana IslandsOECD membersOmanOther small statesPacific island small statesPakistanPalauPanamaPapua New GuineaParaguayPeruPhilippinesQatarRwandaSamoaSao Tome and PrincipeSaudi ArabiaSenegalSerbiaSeychellesSierra LeoneSingaporeSloveniaSmall statesSolomon IslandsSomaliaSouth AfricaSouth AsiaSouth Asia (IDA & IBRD)South SudanSri LankaSt. Kitts and NevisSt. LuciaSt. Vincent and the GrenadinesSub-Saharan Africa Sub-Saharan Africa (excluding high income)Sub-Saharan Africa (IDA & IBRD countries)SudanSurinameSwazilandSyrian Arab RepublicTajikistanTanzaniaThailandTimor-LesteTogoTongaTrinidad and TobagoTunisiaTurkeyTurkmenistanTurks and Caicos IslandsTuvaluUgandaUkraineUnited Arab EmiratesUpper middle incomeUruguayUzbekistanVanuatuVenezuela, RBVietnamWest Bank and GazaWorldYemen, Rep.ZambiaZimbabwe Zeitlinie:
Diese Zeitleiste vorliegt die Graphik ab 1976 J. bis 2015 J. Tuvalu. Die Angaben bis 1975 J. sind nicht vorhanden. Die Zahl aktueller Beobachtungen nach Daten: 40.
Die Quelle (Bezeichnung):
Kennzahlen der Weltentwicklung
Die Quelle (Einrichtung):
Development Assistance Committee of the Organisation for Economic Co-operation and Development, Geographical Distribution of Financial Flows to Developing Countries, Development Co-operation Report, and International Development Statistics database. Data are available online at: www.oecd.org/dac/stats/idsonline. World Bank population estimates are used for the denominator.
Kategorien:
Aid Effectiveness, Economy & Growth, External Debt
Es wurde aktualisiert:
23 Apr 2017 Jahr
Kennzahlen der Wertänderungen vom Jahr zum Jahr
im Durchschnitt:
1.093 Tsnd.
Minimum:
6.506
1 Jan 1976 Jahr
Maximum:
3.95 Tsnd.
1 Jan 2012 Jahr
Zum Datum der Beobachtung
Wert
Absolute Veränderung
Die Veränderung bezüglich dem vorherigen Wert
1 Jan 1976 Jahr
6.506
+6.506
0.0%
1 Jan 1977 Jahr
379.257
+372.751
5.73 Tsnd.%
1 Jan 1978 Jahr
304.504
-74.753
-19.71%
1 Jan 1979 Jahr
361.537
+57.034
18.73%
1 Jan 1980 Jahr
515.14
+153.603
42.49%
1 Jan 1981 Jahr
609.862
+94.722
18.39%
1 Jan 1982 Jahr
655.637
+45.775
7.51%
1 Jan 1983 Jahr
752.052
+96.415
14.71%
1 Jan 1984 Jahr
500.416
-251.636
-33.46%
1 Jan 1985 Jahr
640.74
+140.324
28.04%
1 Jan 1986 Jahr
385.06
-255.68
-39.9%
1 Jan 1987 Jahr
491.935
+106.874
27.76%
1 Jan 1988 Jahr
2.911 Tsnd.
+2.419 Tsnd.
491.79%
1 Jan 1989 Jahr
1.572 Tsnd.
-1.34 Tsnd.
-46.02%
1 Jan 1990 Jahr
773.271
-798.335
-50.8%
1 Jan 1991 Jahr
561.972
-211.298
-27.33%
1 Jan 1992 Jahr
553.224
-8.748
-1.56%
1 Jan 1993 Jahr
885.422
+332.198
60.05%
1 Jan 1994 Jahr
464.582
-420.84
-47.53%
1 Jan 1995 Jahr
802.133
+337.551
72.66%
1 Jan 1996 Jahr
850.764
+48.631
6.06%
1 Jan 1997 Jahr
1.116 Tsnd.
+265.384
31.19%
1 Jan 1998 Jahr
1.089 Tsnd.
-26.667
-2.39%
1 Jan 1999 Jahr
556.032
-533.45
-48.96%
1 Jan 2000 Jahr
723.277
+167.245
30.08%
1 Jan 2001 Jahr
427.859
-295.419
-40.84%
1 Jan 2002 Jahr
1.004 Tsnd.
+576.259
134.68%
1 Jan 2003 Jahr
1.229 Tsnd.
+224.633
22.37%
1 Jan 2004 Jahr
650.678
-578.074
-47.05%
1 Jan 2005 Jahr
829.359
+178.682
27.46%
1 Jan 2006 Jahr
949.041
+119.681
14.43%
1 Jan 2007 Jahr
1.576 Tsnd.
+627.203
66.09%
1 Jan 2008 Jahr
1.202 Tsnd.
-373.867
-23.72%
1 Jan 2009 Jahr
1.647 Tsnd.
+444.539
36.97%
1 Jan 2010 Jahr
1.781 Tsnd.
+134.284
8.15%
1 Jan 2011 Jahr
1.356 Tsnd.
-424.732
-23.85%
1 Jan 2012 Jahr
3.95 Tsnd.
+2.593 Tsnd.
191.17%
1 Jan 2013 Jahr
2.484 Tsnd.
-1.466 Tsnd.
-37.11%
1 Jan 2014 Jahr
2.714 Tsnd.
+229.876
9.26%
1 Jan 2015 Jahr
3.476 Tsnd.
+762.546
28.1%
Bewertung der Länder gemäß mit laufender Statistik nach Jahren


Kommentare: