29
/de/
de
AIzaSyAYiBZKx7MnpbEhh9jyipgxe19OcubqV5w
April 1, 2024
62440
World
WLD
false
2
1
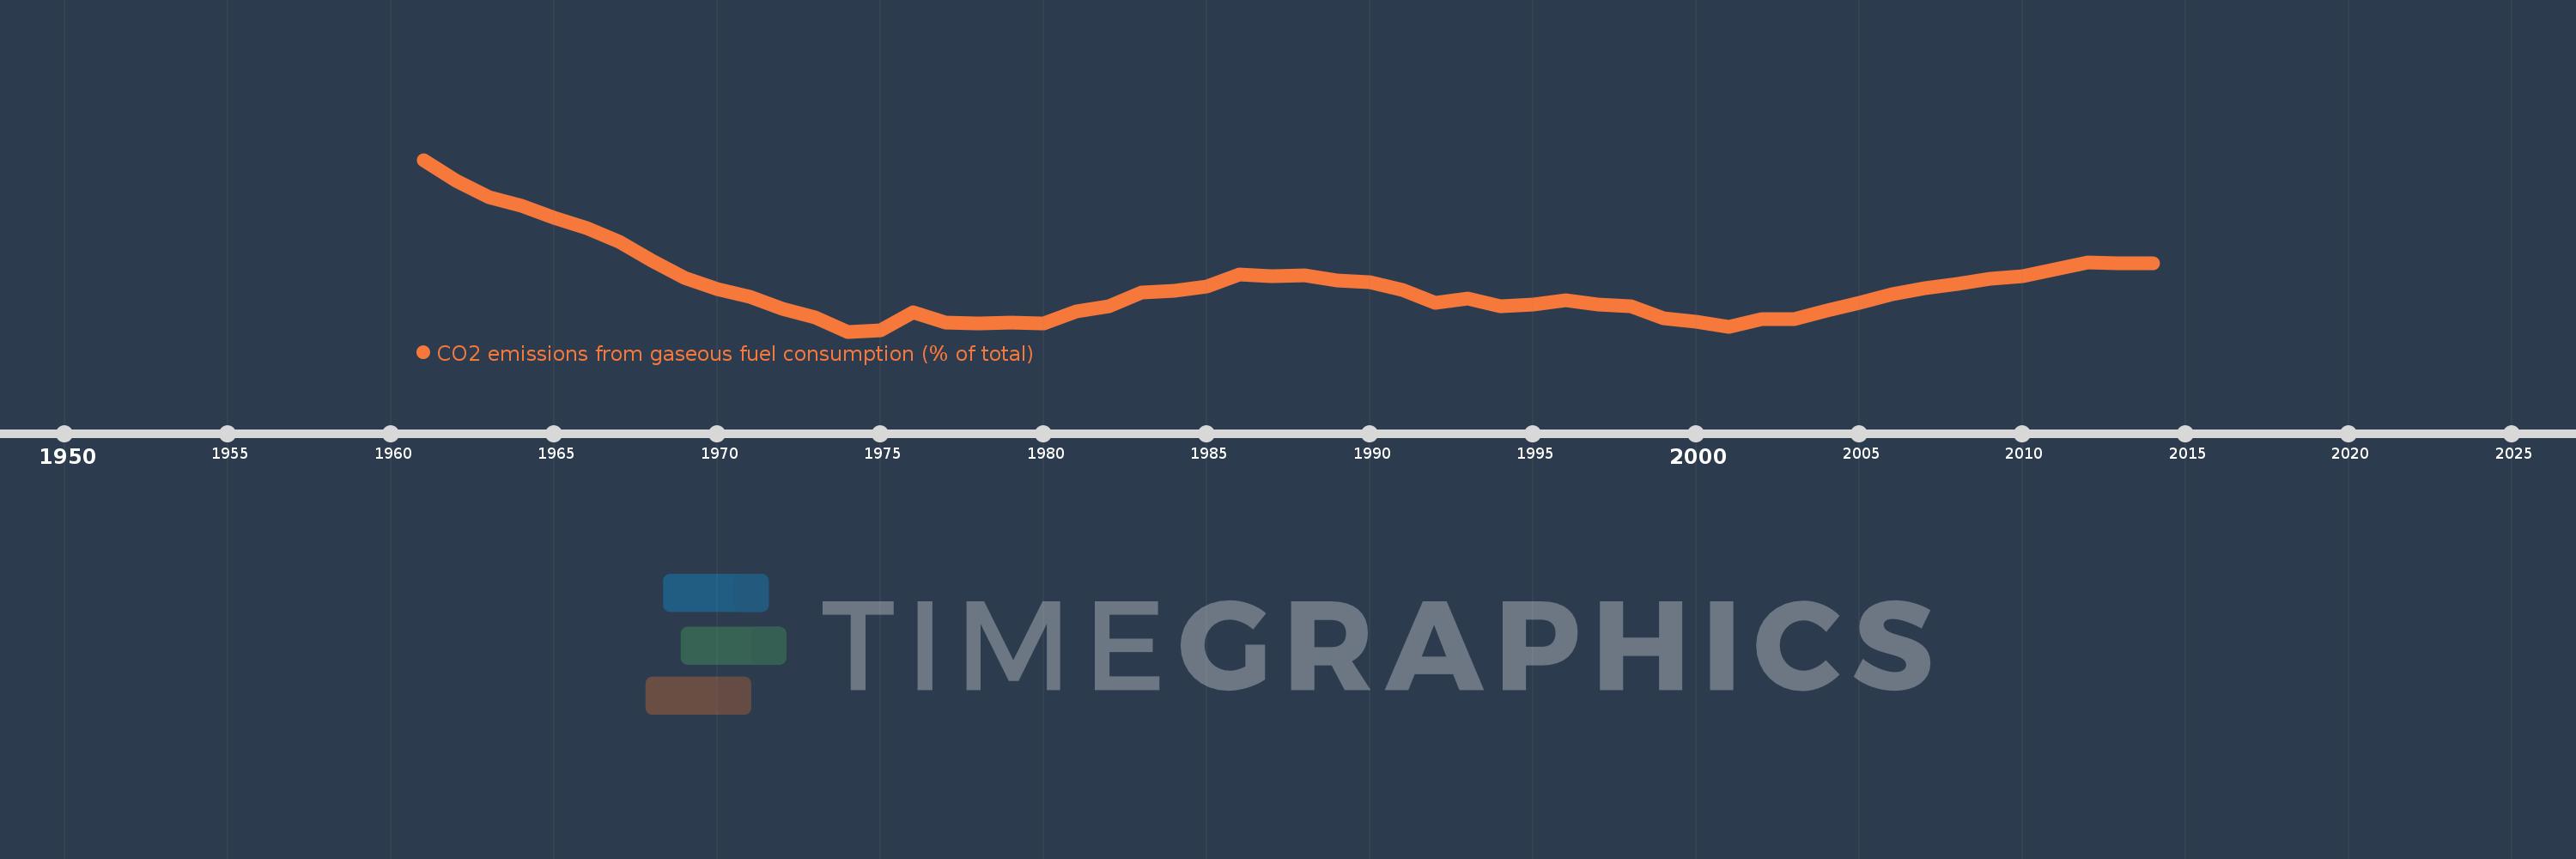
CO2 emissions from gaseous fuel consumption (% of total)
2014,2013,2012,2011,2010,2009,2008,2007,2006,2005,2004,2003,2002,2001,2000,1999,1998,1997,1996,1995,1994,1993,1992,1991,1990,1989,1988,1987,1986,1985,1984,1983,1982,1981,1980,1979,1978,1977,1976,1975,1974,1973,1972,1971,1970,1969,1968,1967,1966,1965,1964,1963,1962,1961
Diese Statistik in anderen Ländern:
AfghanistanAlbaniaAlgeriaAndorraAngolaAntigua and BarbudaArab WorldArgentinaArmeniaArubaAustraliaAustriaAzerbaijanBahamas, TheBahrainBangladeshBarbadosBelarusBelgiumBelizeBeninBermudaBhutanBoliviaBosnia and HerzegovinaBotswanaBrazilBritish Virgin IslandsBrunei DarussalamBulgariaBurkina FasoBurundiCabo VerdeCambodiaCameroonCanadaCaribbean small statesCayman IslandsCentral African RepublicCentral Europe and the BalticsChadChileChinaColombiaComorosCongo, Dem. Rep.Congo, Rep.Costa RicaCote d'IvoireCroatiaCubaCuracaoCyprusCzech RepublicDenmarkDjiboutiDominicaDominican RepublicEarly-demographic dividendEast Asia & PacificEast Asia & Pacific (excluding high income)East Asia & Pacific (IDA & IBRD countries)EcuadorEgypt, Arab Rep.El SalvadorEquatorial GuineaEritreaEstoniaEthiopiaEuro areaEurope & Central AsiaEurope & Central Asia (excluding high income)Europe & Central Asia (IDA & IBRD countries)European UnionFaroe IslandsFijiFinlandFragile and conflict affected situationsFranceFrench PolynesiaGabonGambia, TheGeorgiaGermanyGhanaGibraltarGreeceGreenlandGrenadaGuatemalaGuineaGuinea-BissauGuyanaHaitiHeavily indebted poor countries (HIPC)High incomeHondurasHong Kong SAR, ChinaHungaryIBRD onlyIcelandIDA & IBRD totalIDA blendIDA onlyIDA totalIndiaIndonesiaIran, Islamic Rep.IraqIrelandIsraelItalyJamaicaJapanJordanKazakhstanKenyaKiribatiKorea, Dem. People’s Rep.Korea, Rep.KuwaitKyrgyz RepublicLao PDRLate-demographic dividendLatin America & Caribbean Latin America & Caribbean (excluding high income)Latin America & the Caribbean (IDA & IBRD countries)LatviaLeast developed countries: UN classificationLebanonLesothoLiberiaLibyaLiechtensteinLithuaniaLow & middle incomeLow incomeLower middle incomeLuxembourgMacao SAR, ChinaMacedonia, FYRMadagascarMalawiMalaysiaMaldivesMaliMaltaMarshall IslandsMauritaniaMauritiusMexicoMicronesia, Fed. Sts.Middle East & North AfricaMiddle East & North Africa (excluding high income)Middle East & North Africa (IDA & IBRD countries)Middle incomeMoldovaMongoliaMontenegroMoroccoMozambiqueMyanmarNamibiaNauruNepalNetherlandsNew CaledoniaNew ZealandNicaraguaNigerNigeriaNorth AmericaNorwayOECD membersOmanOther small statesPacific island small statesPakistanPalauPanamaPapua New GuineaParaguayPeruPhilippinesPolandPortugalPost-demographic dividendPre-demographic dividendQatarRomaniaRussian FederationRwandaSamoaSao Tome and PrincipeSaudi ArabiaSenegalSerbiaSeychellesSierra LeoneSingaporeSint Maarten (Dutch part)Slovak RepublicSloveniaSmall statesSolomon IslandsSomaliaSouth AfricaSouth AsiaSouth Asia (IDA & IBRD)South SudanSpainSri LankaSt. Kitts and NevisSt. LuciaSt. Vincent and the GrenadinesSub-Saharan Africa Sub-Saharan Africa (excluding high income)Sub-Saharan Africa (IDA & IBRD countries)SudanSurinameSwazilandSwedenSwitzerlandSyrian Arab RepublicTajikistanTanzaniaThailandTimor-LesteTogoTongaTrinidad and TobagoTunisiaTurkeyTurkmenistanTurks and Caicos IslandsUgandaUkraineUnited Arab EmiratesUnited KingdomUnited StatesUpper middle incomeUruguayUzbekistanVanuatuVenezuela, RBVietnamWest Bank and GazaWorldYemen, Rep.ZambiaZimbabwe Zeitlinie:
Diese Zeitleiste vorliegt die Graphik ab 1961 J. bis 2014 J. World. Die Angaben bis 1960 J. sind nicht vorhanden. Die Zahl aktueller Beobachtungen nach Daten: 54.
Die Quelle (Bezeichnung):
Kennzahlen der Weltentwicklung
Die Quelle (Einrichtung):
Carbon Dioxide Information Analysis Center, Environmental Sciences Division, Oak Ridge National Laboratory, Tennessee, United States.
Kategorien:
Energy & Mining, Climate Change, Environment
Es wurde aktualisiert:
23 Apr 2017 Jahr
Kennzahlen der Wertänderungen vom Jahr zum Jahr
Minimum:
34.028
1 Jan 1974 Jahr
Maximum:
54.829
1 Jan 1961 Jahr
Zum Datum der Beobachtung
Wert
Absolute Veränderung
Die Veränderung bezüglich dem vorherigen Wert
1 Jan 1961 Jahr
54.829
+54.829
0.0%
1 Jan 1962 Jahr
52.255
-2.574
-4.69%
1 Jan 1963 Jahr
50.253
-2.003
-3.83%
1 Jan 1964 Jahr
49.215
-1.038
-2.06%
1 Jan 1965 Jahr
47.801
-1.414
-2.87%
1 Jan 1966 Jahr
46.575
-1.226
-2.57%
1 Jan 1967 Jahr
44.888
-1.687
-3.62%
1 Jan 1968 Jahr
42.559
-2.329
-5.19%
1 Jan 1969 Jahr
40.488
-2.071
-4.87%
1 Jan 1970 Jahr
39.185
-1.303
-3.22%
1 Jan 1971 Jahr
38.218
-0.966
-2.47%
1 Jan 1972 Jahr
36.808
-1.411
-3.69%
1 Jan 1973 Jahr
35.715
-1.093
-2.97%
1 Jan 1974 Jahr
34.028
-1.687
-4.72%
1 Jan 1975 Jahr
34.156
+0.128
0.38%
1 Jan 1976 Jahr
36.402
+2.246
6.58%
1 Jan 1977 Jahr
35.157
-1.245
-3.42%
1 Jan 1978 Jahr
35.009
-0.148
-0.42%
1 Jan 1979 Jahr
35.081
+0.073
0.21%
1 Jan 1980 Jahr
35.001
-0.08
-0.23%
1 Jan 1981 Jahr
36.503
+1.502
4.29%
1 Jan 1982 Jahr
37.136
+0.633
1.73%
1 Jan 1983 Jahr
38.792
+1.656
4.46%
1 Jan 1984 Jahr
38.957
+0.165
0.43%
1 Jan 1985 Jahr
39.446
+0.489
1.26%
1 Jan 1986 Jahr
40.91
+1.464
3.71%
1 Jan 1987 Jahr
40.786
-0.124
-0.3%
1 Jan 1988 Jahr
40.858
+0.071
0.18%
1 Jan 1989 Jahr
40.214
-0.644
-1.58%
1 Jan 1990 Jahr
40.028
-0.186
-0.46%
1 Jan 1991 Jahr
39.11
-0.919
-2.3%
1 Jan 1992 Jahr
37.468
-1.641
-4.2%
1 Jan 1993 Jahr
38.023
+0.555
1.48%
1 Jan 1994 Jahr
37.061
-0.962
-2.53%
1 Jan 1995 Jahr
37.297
+0.236
0.64%
1 Jan 1996 Jahr
37.808
+0.511
1.37%
1 Jan 1997 Jahr
37.323
-0.485
-1.28%
1 Jan 1998 Jahr
37.117
-0.206
-0.55%
1 Jan 1999 Jahr
35.657
-1.461
-3.94%
1 Jan 2000 Jahr
35.204
-0.453
-1.27%
1 Jan 2001 Jahr
34.592
-0.612
-1.74%
1 Jan 2002 Jahr
35.507
+0.915
2.64%
1 Jan 2003 Jahr
35.531
+0.024
0.07%
1 Jan 2004 Jahr
36.568
+1.037
2.92%
1 Jan 2005 Jahr
37.544
+0.975
2.67%
1 Jan 2006 Jahr
38.604
+1.061
2.83%
1 Jan 2007 Jahr
39.328
+0.724
1.88%
1 Jan 2008 Jahr
39.844
+0.516
1.31%
1 Jan 2009 Jahr
40.398
+0.554
1.39%
1 Jan 2010 Jahr
40.701
+0.303
0.75%
1 Jan 2011 Jahr
41.534
+0.833
2.05%
1 Jan 2012 Jahr
42.354
+0.819
1.97%
1 Jan 2013 Jahr
42.25
-0.104
-0.25%
1 Jan 2014 Jahr
42.257
+0.007
0.02%
Bewertung der Länder gemäß mit laufender Statistik nach Jahren


Kommentare: