29
/de/
de
AIzaSyAYiBZKx7MnpbEhh9jyipgxe19OcubqV5w
April 1, 2024
121875
Dominican Republic
DOM
true
2
1
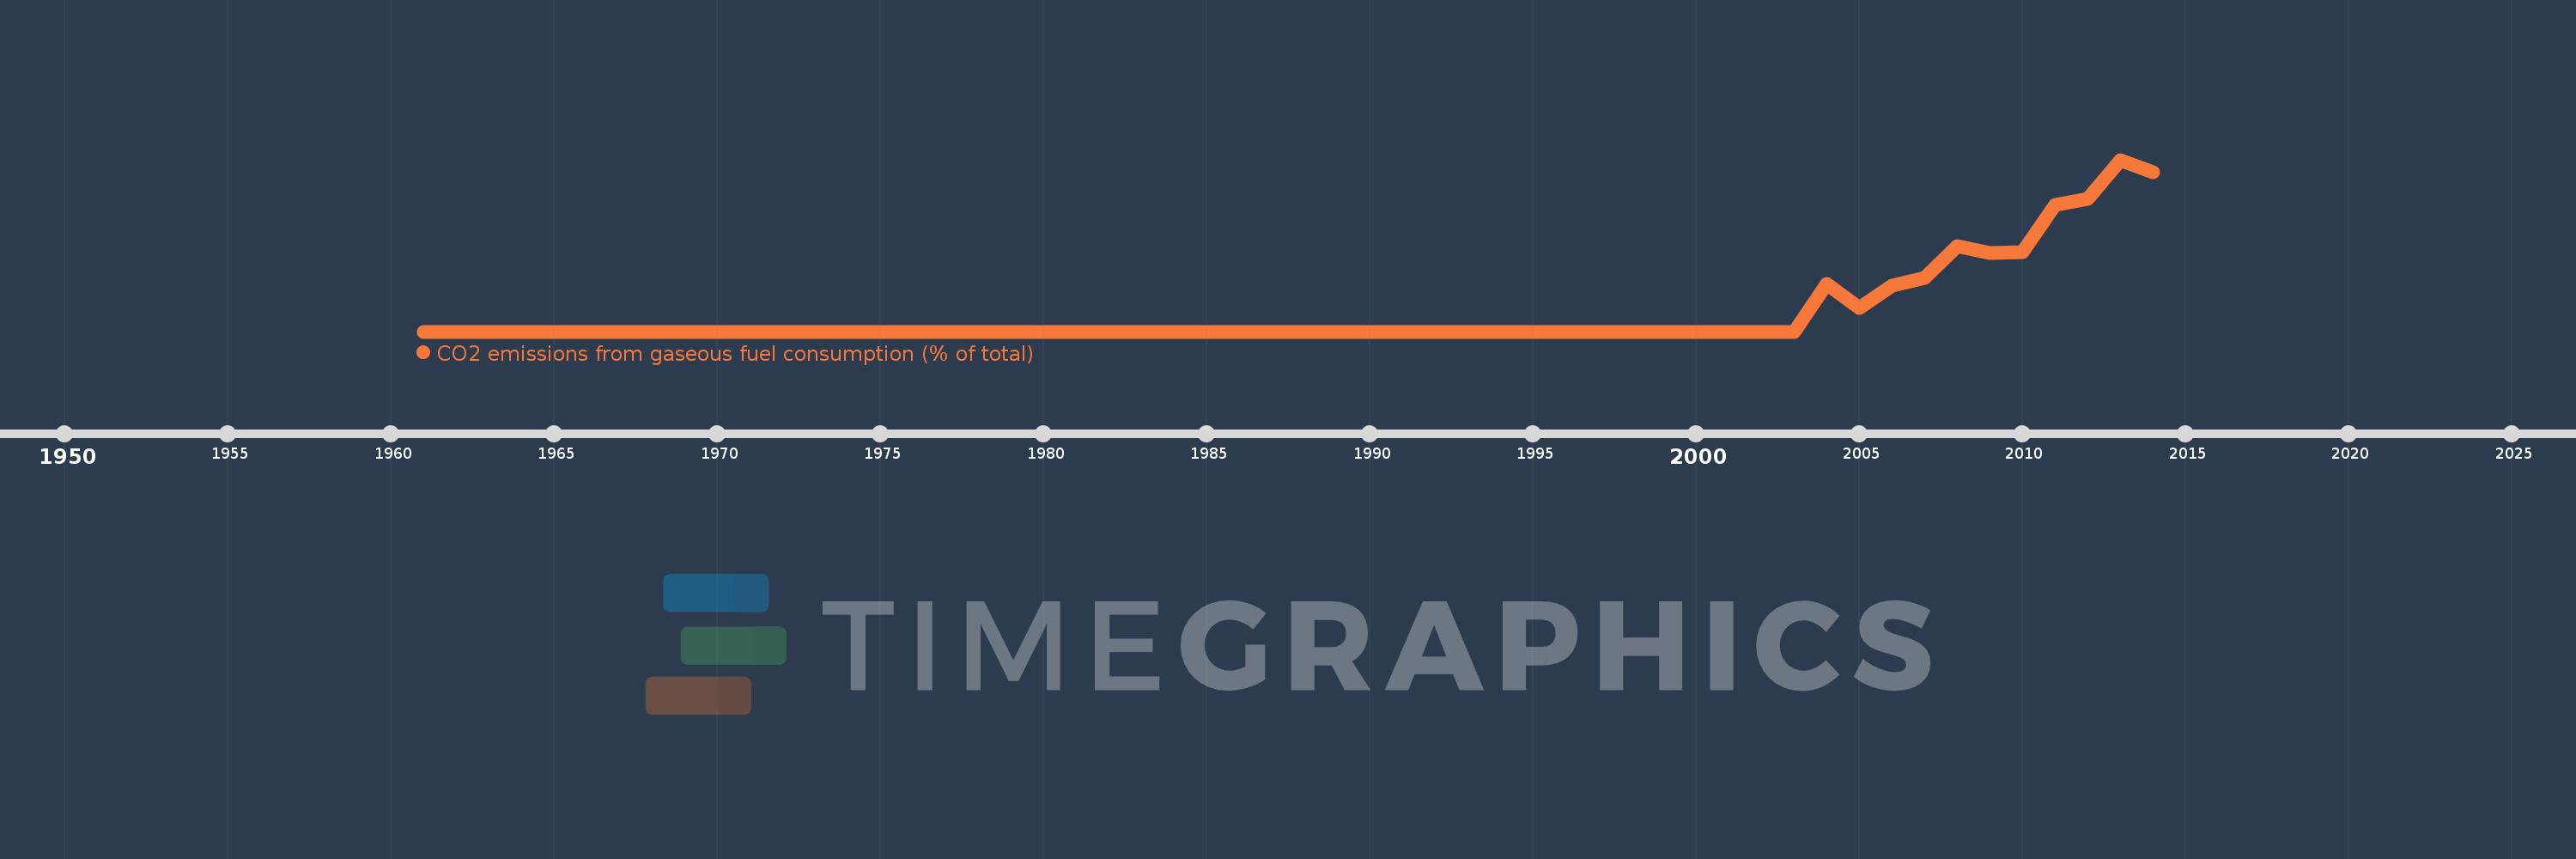
CO2 emissions from gaseous fuel consumption (% of total)
2014,2013,2012,2011,2010,2009,2008,2007,2006,2005,2004,2003,2002,2001,2000,1999,1998,1997,1996,1995,1994,1993,1992,1991,1990,1989,1988,1987,1986,1985,1984,1983,1982,1981,1980,1979,1978,1977,1976,1975,1974,1973,1972,1971,1970,1969,1968,1967,1966,1965,1964,1963,1962,1961
Diese Statistik in anderen Ländern:
AfghanistanAlbaniaAlgeriaAndorraAngolaAntigua and BarbudaArab WorldArgentinaArmeniaArubaAustraliaAustriaAzerbaijanBahamas, TheBahrainBangladeshBarbadosBelarusBelgiumBelizeBeninBermudaBhutanBoliviaBosnia and HerzegovinaBotswanaBrazilBritish Virgin IslandsBrunei DarussalamBulgariaBurkina FasoBurundiCabo VerdeCambodiaCameroonCanadaCaribbean small statesCayman IslandsCentral African RepublicCentral Europe and the BalticsChadChileChinaColombiaComorosCongo, Dem. Rep.Congo, Rep.Costa RicaCote d'IvoireCroatiaCubaCuracaoCyprusCzech RepublicDenmarkDjiboutiDominicaDominican RepublicEarly-demographic dividendEast Asia & PacificEast Asia & Pacific (excluding high income)East Asia & Pacific (IDA & IBRD countries)EcuadorEgypt, Arab Rep.El SalvadorEquatorial GuineaEritreaEstoniaEthiopiaEuro areaEurope & Central AsiaEurope & Central Asia (excluding high income)Europe & Central Asia (IDA & IBRD countries)European UnionFaroe IslandsFijiFinlandFragile and conflict affected situationsFranceFrench PolynesiaGabonGambia, TheGeorgiaGermanyGhanaGibraltarGreeceGreenlandGrenadaGuatemalaGuineaGuinea-BissauGuyanaHaitiHeavily indebted poor countries (HIPC)High incomeHondurasHong Kong SAR, ChinaHungaryIBRD onlyIcelandIDA & IBRD totalIDA blendIDA onlyIDA totalIndiaIndonesiaIran, Islamic Rep.IraqIrelandIsraelItalyJamaicaJapanJordanKazakhstanKenyaKiribatiKorea, Dem. People’s Rep.Korea, Rep.KuwaitKyrgyz RepublicLao PDRLate-demographic dividendLatin America & Caribbean Latin America & Caribbean (excluding high income)Latin America & the Caribbean (IDA & IBRD countries)LatviaLeast developed countries: UN classificationLebanonLesothoLiberiaLibyaLiechtensteinLithuaniaLow & middle incomeLow incomeLower middle incomeLuxembourgMacao SAR, ChinaMacedonia, FYRMadagascarMalawiMalaysiaMaldivesMaliMaltaMarshall IslandsMauritaniaMauritiusMexicoMicronesia, Fed. Sts.Middle East & North AfricaMiddle East & North Africa (excluding high income)Middle East & North Africa (IDA & IBRD countries)Middle incomeMoldovaMongoliaMontenegroMoroccoMozambiqueMyanmarNamibiaNauruNepalNetherlandsNew CaledoniaNew ZealandNicaraguaNigerNigeriaNorth AmericaNorwayOECD membersOmanOther small statesPacific island small statesPakistanPalauPanamaPapua New GuineaParaguayPeruPhilippinesPolandPortugalPost-demographic dividendPre-demographic dividendQatarRomaniaRussian FederationRwandaSamoaSao Tome and PrincipeSaudi ArabiaSenegalSerbiaSeychellesSierra LeoneSingaporeSint Maarten (Dutch part)Slovak RepublicSloveniaSmall statesSolomon IslandsSomaliaSouth AfricaSouth AsiaSouth Asia (IDA & IBRD)South SudanSpainSri LankaSt. Kitts and NevisSt. LuciaSt. Vincent and the GrenadinesSub-Saharan Africa Sub-Saharan Africa (excluding high income)Sub-Saharan Africa (IDA & IBRD countries)SudanSurinameSwazilandSwedenSwitzerlandSyrian Arab RepublicTajikistanTanzaniaThailandTimor-LesteTogoTongaTrinidad and TobagoTunisiaTurkeyTurkmenistanTurks and Caicos IslandsUgandaUkraineUnited Arab EmiratesUnited KingdomUnited StatesUpper middle incomeUruguayUzbekistanVanuatuVenezuela, RBVietnamWest Bank and GazaWorldYemen, Rep.ZambiaZimbabwe Zeitlinie:
Diese Zeitleiste vorliegt die Graphik ab 1961 J. bis 2014 J. Dominican Republic. Die Angaben bis 1960 J. sind nicht vorhanden. Die Zahl aktueller Beobachtungen nach Daten: 54.
Die Quelle (Bezeichnung):
Kennzahlen der Weltentwicklung
Die Quelle (Einrichtung):
Carbon Dioxide Information Analysis Center, Environmental Sciences Division, Oak Ridge National Laboratory, Tennessee, United States.
Kategorien:
Energy & Mining, Climate Change, Environment
Es wurde aktualisiert:
23 Apr 2017 Jahr
Kennzahlen der Wertänderungen vom Jahr zum Jahr
Minimum:
0.0
1 Jan 1961 Jahr
Maximum:
9.512
1 Jan 2013 Jahr
Zum Datum der Beobachtung
Wert
Absolute Veränderung
Die Veränderung bezüglich dem vorherigen Wert
1 Jan 1961 Jahr
0.0
0.0
0.0%
1 Jan 2004 Jahr
2.642
+2.642
%
1 Jan 2005 Jahr
1.302
-1.34
-50.72%
1 Jan 2006 Jahr
2.538
+1.236
94.95%
1 Jan 2007 Jahr
2.984
+0.446
17.59%
1 Jan 2008 Jahr
4.745
+1.761
59.02%
1 Jan 2009 Jahr
4.328
-0.417
-8.79%
1 Jan 2010 Jahr
4.423
+0.095
2.18%
1 Jan 2011 Jahr
6.995
+2.572
58.15%
1 Jan 2012 Jahr
7.356
+0.361
5.16%
1 Jan 2013 Jahr
9.512
+2.155
29.3%
1 Jan 2014 Jahr
8.805
-0.706
-7.42%
Bewertung der Länder gemäß mit laufender Statistik nach Jahren


Kommentare: