29
/de/
de
AIzaSyAYiBZKx7MnpbEhh9jyipgxe19OcubqV5w
April 1, 2024
187544
Malaysia
MYS
true
2
1
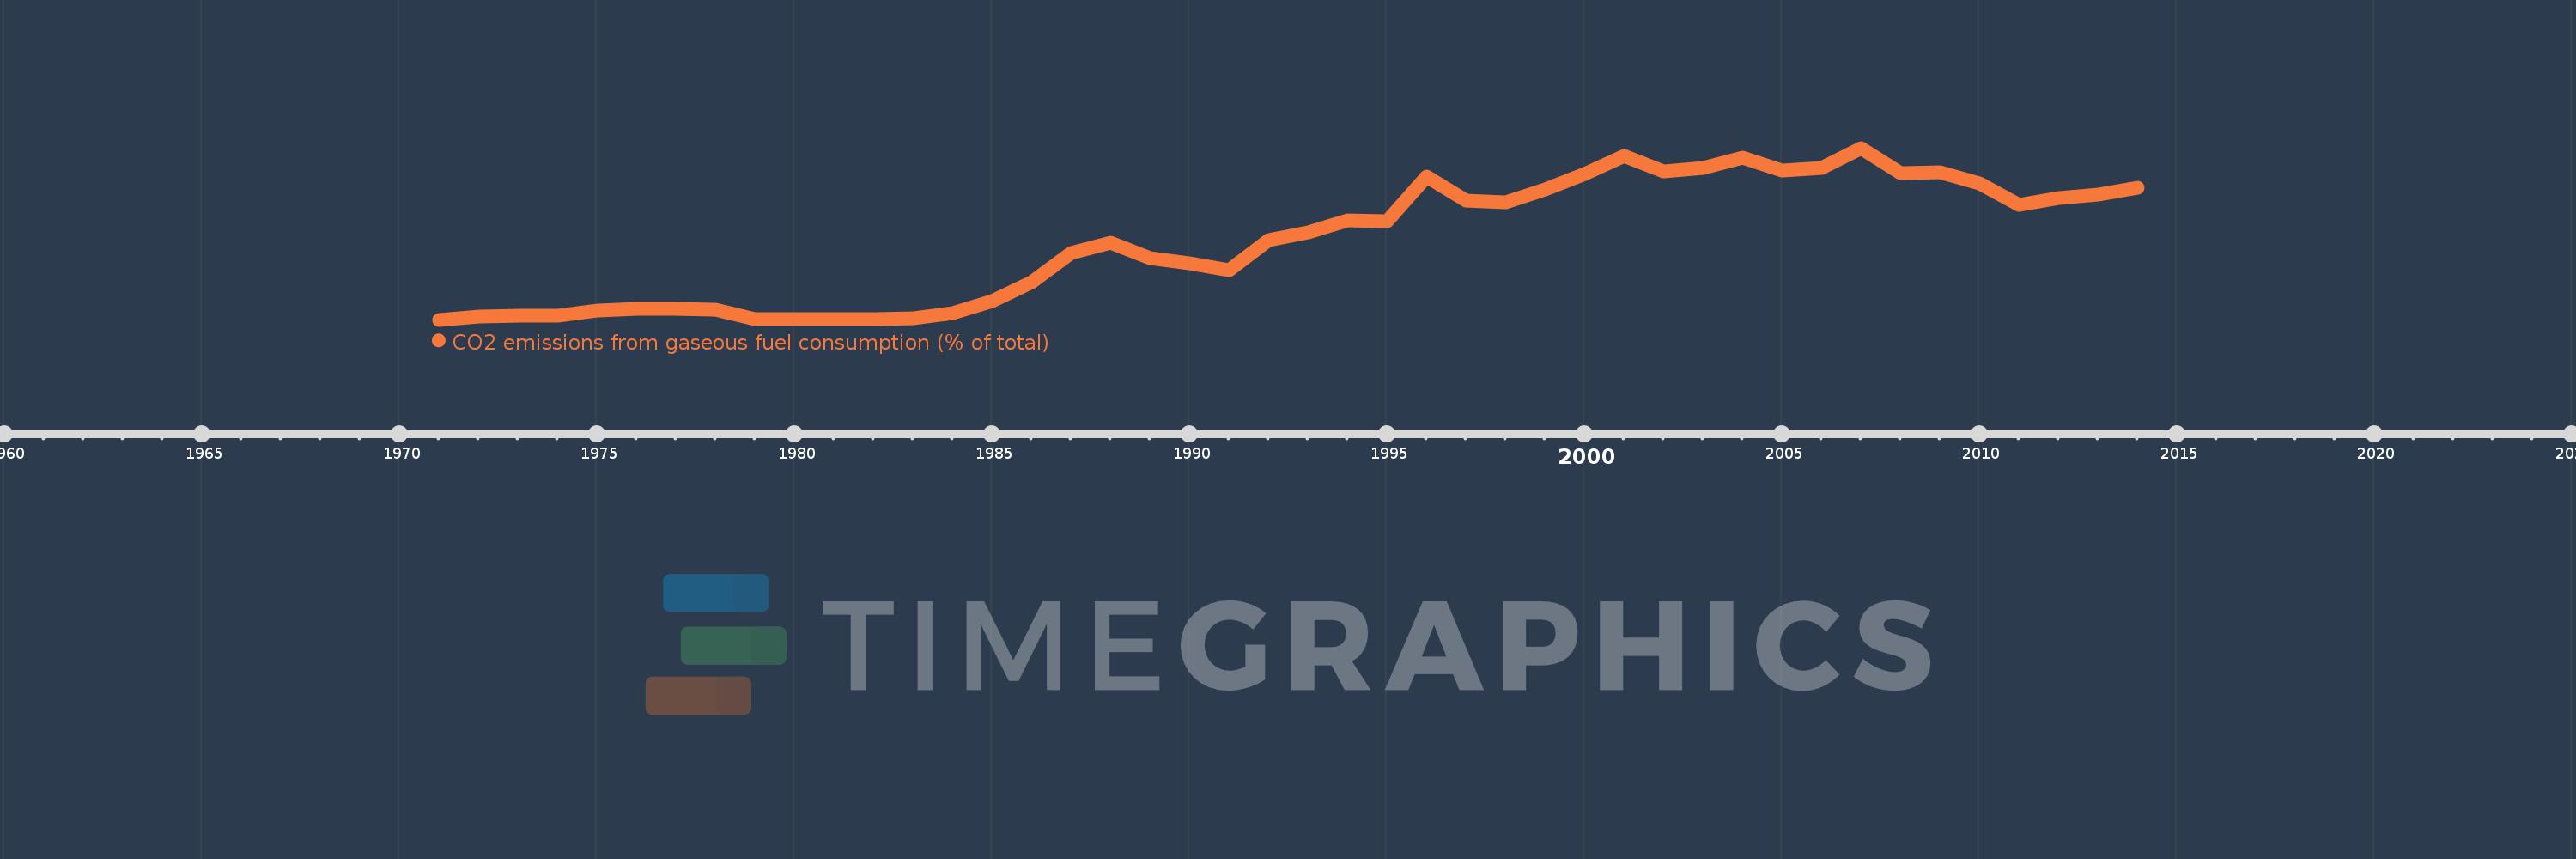
CO2 emissions from gaseous fuel consumption (% of total)
2014,2013,2012,2011,2010,2009,2008,2007,2006,2005,2004,2003,2002,2001,2000,1999,1998,1997,1996,1995,1994,1993,1992,1991,1990,1989,1988,1987,1986,1985,1984,1983,1982,1981,1980,1979,1978,1977,1976,1975,1974,1973,1972,1971
Diese Statistik in anderen Ländern:
AfghanistanAlbaniaAlgeriaAndorraAngolaAntigua and BarbudaArab WorldArgentinaArmeniaArubaAustraliaAustriaAzerbaijanBahamas, TheBahrainBangladeshBarbadosBelarusBelgiumBelizeBeninBermudaBhutanBoliviaBosnia and HerzegovinaBotswanaBrazilBritish Virgin IslandsBrunei DarussalamBulgariaBurkina FasoBurundiCabo VerdeCambodiaCameroonCanadaCaribbean small statesCayman IslandsCentral African RepublicCentral Europe and the BalticsChadChileChinaColombiaComorosCongo, Dem. Rep.Congo, Rep.Costa RicaCote d'IvoireCroatiaCubaCuracaoCyprusCzech RepublicDenmarkDjiboutiDominicaDominican RepublicEarly-demographic dividendEast Asia & PacificEast Asia & Pacific (excluding high income)East Asia & Pacific (IDA & IBRD countries)EcuadorEgypt, Arab Rep.El SalvadorEquatorial GuineaEritreaEstoniaEthiopiaEuro areaEurope & Central AsiaEurope & Central Asia (excluding high income)Europe & Central Asia (IDA & IBRD countries)European UnionFaroe IslandsFijiFinlandFragile and conflict affected situationsFranceFrench PolynesiaGabonGambia, TheGeorgiaGermanyGhanaGibraltarGreeceGreenlandGrenadaGuatemalaGuineaGuinea-BissauGuyanaHaitiHeavily indebted poor countries (HIPC)High incomeHondurasHong Kong SAR, ChinaHungaryIBRD onlyIcelandIDA & IBRD totalIDA blendIDA onlyIDA totalIndiaIndonesiaIran, Islamic Rep.IraqIrelandIsraelItalyJamaicaJapanJordanKazakhstanKenyaKiribatiKorea, Dem. People’s Rep.Korea, Rep.KuwaitKyrgyz RepublicLao PDRLate-demographic dividendLatin America & Caribbean Latin America & Caribbean (excluding high income)Latin America & the Caribbean (IDA & IBRD countries)LatviaLeast developed countries: UN classificationLebanonLesothoLiberiaLibyaLiechtensteinLithuaniaLow & middle incomeLow incomeLower middle incomeLuxembourgMacao SAR, ChinaMacedonia, FYRMadagascarMalawiMalaysiaMaldivesMaliMaltaMarshall IslandsMauritaniaMauritiusMexicoMicronesia, Fed. Sts.Middle East & North AfricaMiddle East & North Africa (excluding high income)Middle East & North Africa (IDA & IBRD countries)Middle incomeMoldovaMongoliaMontenegroMoroccoMozambiqueMyanmarNamibiaNauruNepalNetherlandsNew CaledoniaNew ZealandNicaraguaNigerNigeriaNorth AmericaNorwayOECD membersOmanOther small statesPacific island small statesPakistanPalauPanamaPapua New GuineaParaguayPeruPhilippinesPolandPortugalPost-demographic dividendPre-demographic dividendQatarRomaniaRussian FederationRwandaSamoaSao Tome and PrincipeSaudi ArabiaSenegalSerbiaSeychellesSierra LeoneSingaporeSint Maarten (Dutch part)Slovak RepublicSloveniaSmall statesSolomon IslandsSomaliaSouth AfricaSouth AsiaSouth Asia (IDA & IBRD)South SudanSpainSri LankaSt. Kitts and NevisSt. LuciaSt. Vincent and the GrenadinesSub-Saharan Africa Sub-Saharan Africa (excluding high income)Sub-Saharan Africa (IDA & IBRD countries)SudanSurinameSwazilandSwedenSwitzerlandSyrian Arab RepublicTajikistanTanzaniaThailandTimor-LesteTogoTongaTrinidad and TobagoTunisiaTurkeyTurkmenistanTurks and Caicos IslandsUgandaUkraineUnited Arab EmiratesUnited KingdomUnited StatesUpper middle incomeUruguayUzbekistanVanuatuVenezuela, RBVietnamWest Bank and GazaWorldYemen, Rep.ZambiaZimbabwe Zeitlinie:
Diese Zeitleiste vorliegt die Graphik ab 1971 J. bis 2014 J. Malaysia. Die Angaben bis 1970 J. sind nicht vorhanden. Die Zahl aktueller Beobachtungen nach Daten: 44.
Die Quelle (Bezeichnung):
Kennzahlen der Weltentwicklung
Die Quelle (Einrichtung):
Carbon Dioxide Information Analysis Center, Environmental Sciences Division, Oak Ridge National Laboratory, Tennessee, United States.
Kategorien:
Energy & Mining, Climate Change, Environment
Es wurde aktualisiert:
23 Apr 2017 Jahr
Kennzahlen der Wertänderungen vom Jahr zum Jahr
Minimum:
0.301
1 Jan 1971 Jahr
Maximum:
41.504
1 Jan 2007 Jahr
Zum Datum der Beobachtung
Wert
Absolute Veränderung
Die Veränderung bezüglich dem vorherigen Wert
1 Jan 1971 Jahr
0.301
+0.301
0.0%
1 Jan 1972 Jahr
0.989
+0.688
228.33%
1 Jan 1973 Jahr
1.269
+0.28
28.27%
1 Jan 1974 Jahr
1.298
+0.029
2.28%
1 Jan 1975 Jahr
2.502
+1.204
92.77%
1 Jan 1976 Jahr
2.961
+0.458
18.31%
1 Jan 1977 Jahr
2.855
-0.106
-3.58%
1 Jan 1978 Jahr
2.773
-0.081
-2.85%
1 Jan 1979 Jahr
0.458
-2.316
-83.5%
1 Jan 1980 Jahr
0.43
-0.027
-6.0%
1 Jan 1981 Jahr
0.498
+0.068
15.7%
1 Jan 1982 Jahr
0.5
+0.002
0.39%
1 Jan 1983 Jahr
0.552
+0.052
10.43%
1 Jan 1984 Jahr
1.951
+1.399
253.55%
1 Jan 1985 Jahr
4.745
+2.795
143.26%
1 Jan 1986 Jahr
9.35
+4.605
97.04%
1 Jan 1987 Jahr
16.352
+7.001
74.88%
1 Jan 1988 Jahr
18.847
+2.495
15.26%
1 Jan 1989 Jahr
15.097
-3.749
-19.89%
1 Jan 1990 Jahr
13.828
-1.27
-8.41%
1 Jan 1991 Jahr
12.091
-1.737
-12.56%
1 Jan 1992 Jahr
19.396
+7.305
60.42%
1 Jan 1993 Jahr
21.272
+1.876
9.67%
1 Jan 1994 Jahr
24.036
+2.763
12.99%
1 Jan 1995 Jahr
23.837
-0.199
-0.83%
1 Jan 1996 Jahr
34.708
+10.871
45.61%
1 Jan 1997 Jahr
28.938
-5.769
-16.62%
1 Jan 1998 Jahr
28.417
-0.521
-1.8%
1 Jan 1999 Jahr
31.501
+3.083
10.85%
1 Jan 2000 Jahr
35.197
+3.697
11.74%
1 Jan 2001 Jahr
39.539
+4.341
12.33%
1 Jan 2002 Jahr
35.851
-3.688
-9.33%
1 Jan 2003 Jahr
36.686
+0.835
2.33%
1 Jan 2004 Jahr
39.134
+2.448
6.67%
1 Jan 2005 Jahr
36.176
-2.958
-7.56%
1 Jan 2006 Jahr
36.755
+0.579
1.6%
1 Jan 2007 Jahr
41.504
+4.749
12.92%
1 Jan 2008 Jahr
35.437
-6.067
-14.62%
1 Jan 2009 Jahr
35.627
+0.191
0.54%
1 Jan 2010 Jahr
32.945
-2.682
-7.53%
1 Jan 2011 Jahr
27.855
-5.09
-15.45%
1 Jan 2012 Jahr
29.417
+1.561
5.61%
1 Jan 2013 Jahr
30.334
+0.917
3.12%
1 Jan 2014 Jahr
31.871
+1.537
5.07%
Bewertung der Länder gemäß mit laufender Statistik nach Jahren


Kommentare: