29
/de/
de
AIzaSyAYiBZKx7MnpbEhh9jyipgxe19OcubqV5w
April 1, 2024
52464
OECD members
OED
false
2
1
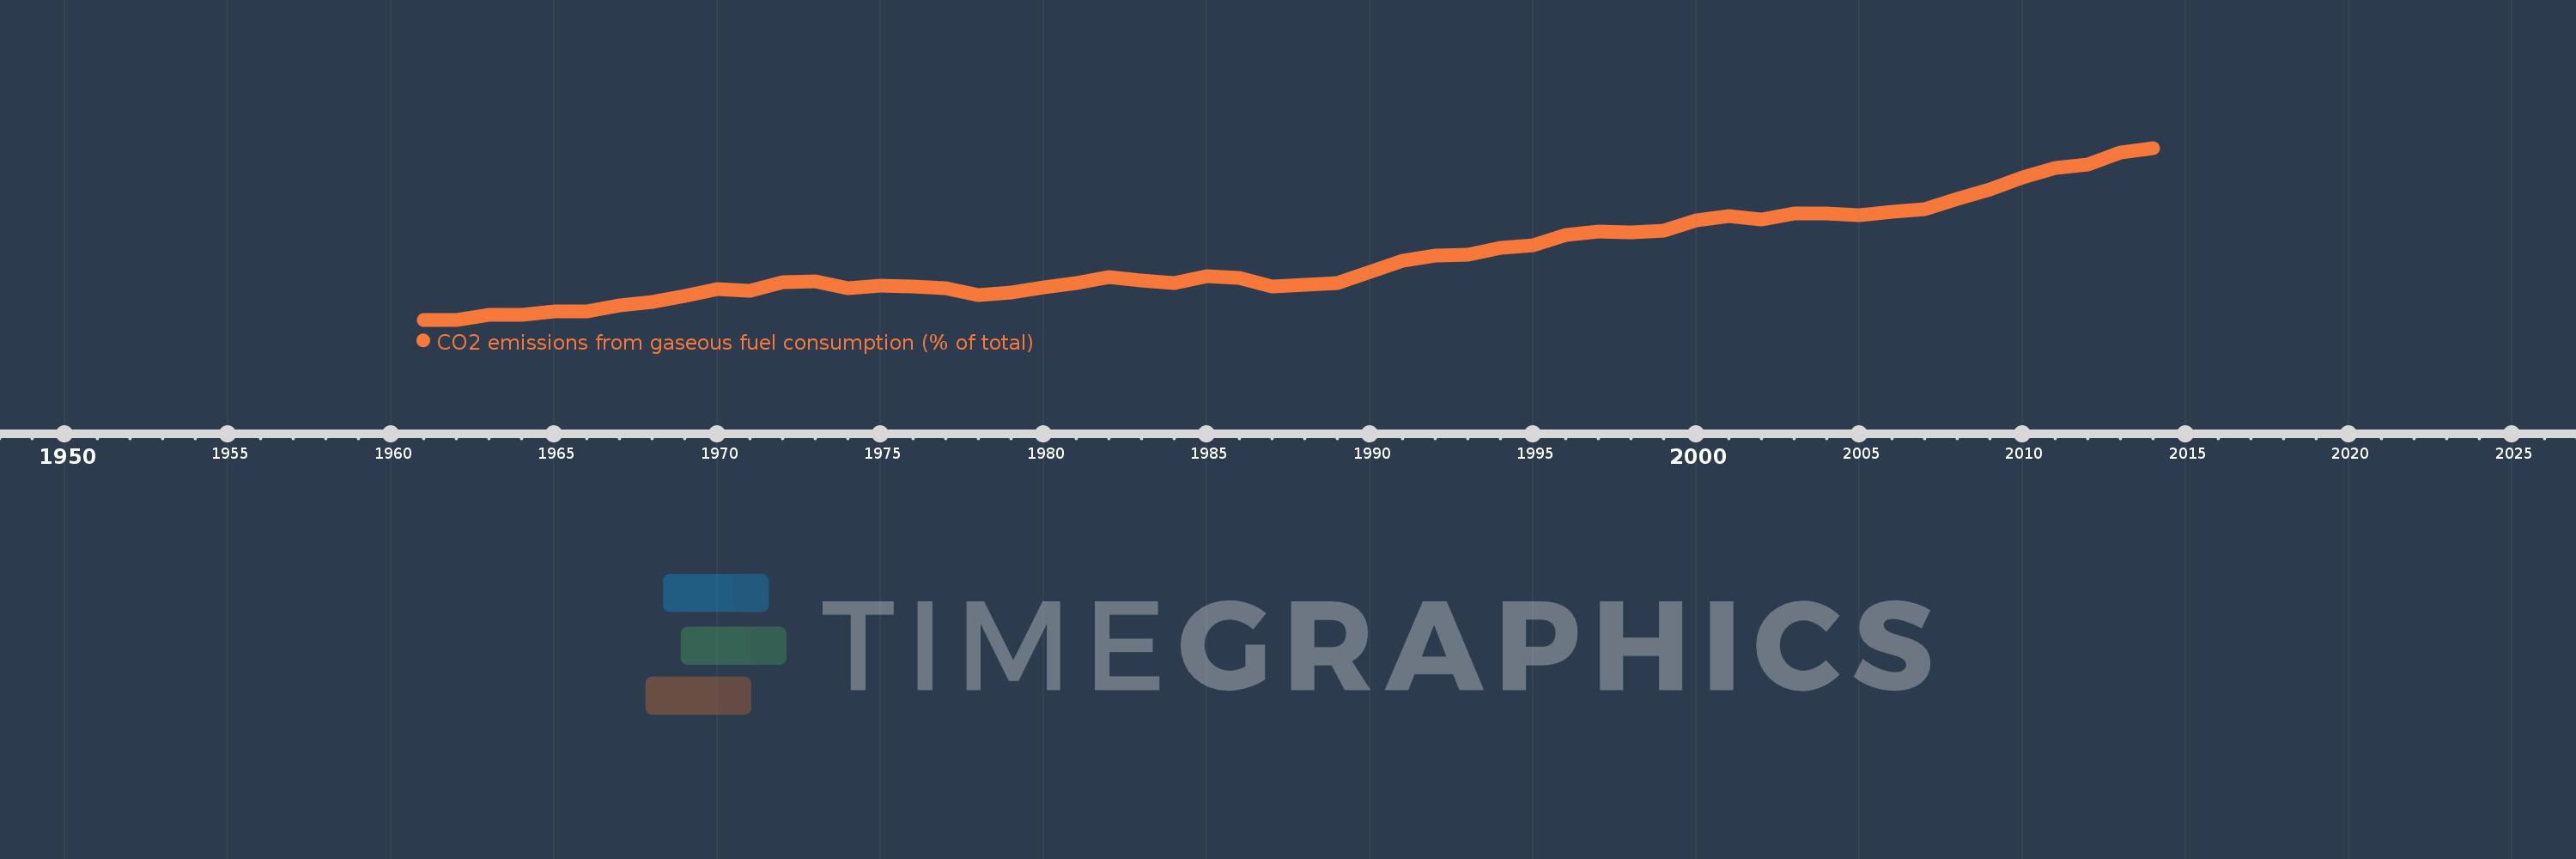
CO2 emissions from gaseous fuel consumption (% of total)
2014,2013,2012,2011,2010,2009,2008,2007,2006,2005,2004,2003,2002,2001,2000,1999,1998,1997,1996,1995,1994,1993,1992,1991,1990,1989,1988,1987,1986,1985,1984,1983,1982,1981,1980,1979,1978,1977,1976,1975,1974,1973,1972,1971,1970,1969,1968,1967,1966,1965,1964,1963,1962,1961
Diese Statistik in anderen Ländern:
AfghanistanAlbaniaAlgeriaAndorraAngolaAntigua and BarbudaArab WorldArgentinaArmeniaArubaAustraliaAustriaAzerbaijanBahamas, TheBahrainBangladeshBarbadosBelarusBelgiumBelizeBeninBermudaBhutanBoliviaBosnia and HerzegovinaBotswanaBrazilBritish Virgin IslandsBrunei DarussalamBulgariaBurkina FasoBurundiCabo VerdeCambodiaCameroonCanadaCaribbean small statesCayman IslandsCentral African RepublicCentral Europe and the BalticsChadChileChinaColombiaComorosCongo, Dem. Rep.Congo, Rep.Costa RicaCote d'IvoireCroatiaCubaCuracaoCyprusCzech RepublicDenmarkDjiboutiDominicaDominican RepublicEarly-demographic dividendEast Asia & PacificEast Asia & Pacific (excluding high income)East Asia & Pacific (IDA & IBRD countries)EcuadorEgypt, Arab Rep.El SalvadorEquatorial GuineaEritreaEstoniaEthiopiaEuro areaEurope & Central AsiaEurope & Central Asia (excluding high income)Europe & Central Asia (IDA & IBRD countries)European UnionFaroe IslandsFijiFinlandFragile and conflict affected situationsFranceFrench PolynesiaGabonGambia, TheGeorgiaGermanyGhanaGibraltarGreeceGreenlandGrenadaGuatemalaGuineaGuinea-BissauGuyanaHaitiHeavily indebted poor countries (HIPC)High incomeHondurasHong Kong SAR, ChinaHungaryIBRD onlyIcelandIDA & IBRD totalIDA blendIDA onlyIDA totalIndiaIndonesiaIran, Islamic Rep.IraqIrelandIsraelItalyJamaicaJapanJordanKazakhstanKenyaKiribatiKorea, Dem. People’s Rep.Korea, Rep.KuwaitKyrgyz RepublicLao PDRLate-demographic dividendLatin America & Caribbean Latin America & Caribbean (excluding high income)Latin America & the Caribbean (IDA & IBRD countries)LatviaLeast developed countries: UN classificationLebanonLesothoLiberiaLibyaLiechtensteinLithuaniaLow & middle incomeLow incomeLower middle incomeLuxembourgMacao SAR, ChinaMacedonia, FYRMadagascarMalawiMalaysiaMaldivesMaliMaltaMarshall IslandsMauritaniaMauritiusMexicoMicronesia, Fed. Sts.Middle East & North AfricaMiddle East & North Africa (excluding high income)Middle East & North Africa (IDA & IBRD countries)Middle incomeMoldovaMongoliaMontenegroMoroccoMozambiqueMyanmarNamibiaNauruNepalNetherlandsNew CaledoniaNew ZealandNicaraguaNigerNigeriaNorth AmericaNorwayOECD membersOmanOther small statesPacific island small statesPakistanPalauPanamaPapua New GuineaParaguayPeruPhilippinesPolandPortugalPost-demographic dividendPre-demographic dividendQatarRomaniaRussian FederationRwandaSamoaSao Tome and PrincipeSaudi ArabiaSenegalSerbiaSeychellesSierra LeoneSingaporeSint Maarten (Dutch part)Slovak RepublicSloveniaSmall statesSolomon IslandsSomaliaSouth AfricaSouth AsiaSouth Asia (IDA & IBRD)South SudanSpainSri LankaSt. Kitts and NevisSt. LuciaSt. Vincent and the GrenadinesSub-Saharan Africa Sub-Saharan Africa (excluding high income)Sub-Saharan Africa (IDA & IBRD countries)SudanSurinameSwazilandSwedenSwitzerlandSyrian Arab RepublicTajikistanTanzaniaThailandTimor-LesteTogoTongaTrinidad and TobagoTunisiaTurkeyTurkmenistanTurks and Caicos IslandsUgandaUkraineUnited Arab EmiratesUnited KingdomUnited StatesUpper middle incomeUruguayUzbekistanVanuatuVenezuela, RBVietnamWest Bank and GazaWorldYemen, Rep.ZambiaZimbabwe Zeitlinie:
Diese Zeitleiste vorliegt die Graphik ab 1961 J. bis 2014 J. OECD members. Die Angaben bis 1960 J. sind nicht vorhanden. Die Zahl aktueller Beobachtungen nach Daten: 54.
Die Quelle (Bezeichnung):
Kennzahlen der Weltentwicklung
Die Quelle (Einrichtung):
Carbon Dioxide Information Analysis Center, Environmental Sciences Division, Oak Ridge National Laboratory, Tennessee, United States.
Kategorien:
Energy & Mining, Climate Change, Environment
Es wurde aktualisiert:
23 Apr 2017 Jahr
Kennzahlen der Wertänderungen vom Jahr zum Jahr
Minimum:
13.273
1 Jan 1962 Jahr
Maximum:
25.733
1 Jan 2014 Jahr
Zum Datum der Beobachtung
Wert
Absolute Veränderung
Die Veränderung bezüglich dem vorherigen Wert
1 Jan 1961 Jahr
13.283
+13.283
0.0%
1 Jan 1962 Jahr
13.273
-0.01
-0.07%
1 Jan 1963 Jahr
13.619
+0.346
2.6%
1 Jan 1964 Jahr
13.608
-0.011
-0.08%
1 Jan 1965 Jahr
13.898
+0.29
2.13%
1 Jan 1966 Jahr
13.856
-0.043
-0.31%
1 Jan 1967 Jahr
14.34
+0.484
3.49%
1 Jan 1968 Jahr
14.553
+0.214
1.49%
1 Jan 1969 Jahr
14.998
+0.445
3.05%
1 Jan 1970 Jahr
15.486
+0.488
3.26%
1 Jan 1971 Jahr
15.344
-0.142
-0.92%
1 Jan 1972 Jahr
16.01
+0.665
4.34%
1 Jan 1973 Jahr
16.086
+0.076
0.48%
1 Jan 1974 Jahr
15.568
-0.517
-3.22%
1 Jan 1975 Jahr
15.738
+0.17
1.09%
1 Jan 1976 Jahr
15.682
-0.056
-0.36%
1 Jan 1977 Jahr
15.535
-0.147
-0.94%
1 Jan 1978 Jahr
15.074
-0.461
-2.97%
1 Jan 1979 Jahr
15.249
+0.174
1.16%
1 Jan 1980 Jahr
15.642
+0.394
2.58%
1 Jan 1981 Jahr
15.963
+0.321
2.05%
1 Jan 1982 Jahr
16.367
+0.405
2.53%
1 Jan 1983 Jahr
16.143
-0.225
-1.37%
1 Jan 1984 Jahr
15.958
-0.184
-1.14%
1 Jan 1985 Jahr
16.401
+0.443
2.77%
1 Jan 1986 Jahr
16.329
-0.072
-0.44%
1 Jan 1987 Jahr
15.684
-0.645
-3.95%
1 Jan 1988 Jahr
15.828
+0.145
0.92%
1 Jan 1989 Jahr
15.931
+0.102
0.65%
1 Jan 1990 Jahr
16.733
+0.802
5.03%
1 Jan 1991 Jahr
17.531
+0.798
4.77%
1 Jan 1992 Jahr
17.928
+0.398
2.27%
1 Jan 1993 Jahr
17.988
+0.06
0.33%
1 Jan 1994 Jahr
18.498
+0.509
2.83%
1 Jan 1995 Jahr
18.67
+0.172
0.93%
1 Jan 1996 Jahr
19.404
+0.735
3.93%
1 Jan 1997 Jahr
19.642
+0.237
1.22%
1 Jan 1998 Jahr
19.589
-0.053
-0.27%
1 Jan 1999 Jahr
19.748
+0.159
0.81%
1 Jan 2000 Jahr
20.454
+0.706
3.57%
1 Jan 2001 Jahr
20.788
+0.334
1.63%
1 Jan 2002 Jahr
20.56
-0.228
-1.09%
1 Jan 2003 Jahr
21.003
+0.443
2.15%
1 Jan 2004 Jahr
20.968
-0.035
-0.17%
1 Jan 2005 Jahr
20.854
-0.114
-0.54%
1 Jan 2006 Jahr
21.085
+0.231
1.11%
1 Jan 2007 Jahr
21.285
+0.201
0.95%
1 Jan 2008 Jahr
22.033
+0.747
3.51%
1 Jan 2009 Jahr
22.708
+0.675
3.06%
1 Jan 2010 Jahr
23.578
+0.87
3.83%
1 Jan 2011 Jahr
24.263
+0.685
2.91%
1 Jan 2012 Jahr
24.548
+0.285
1.18%
1 Jan 2013 Jahr
25.396
+0.848
3.45%
1 Jan 2014 Jahr
25.733
+0.337
1.33%
Bewertung der Länder gemäß mit laufender Statistik nach Jahren


Kommentare: