29
/de/
de
AIzaSyAYiBZKx7MnpbEhh9jyipgxe19OcubqV5w
April 1, 2024
59244
Sub-Saharan Africa
SSF
false
2
1
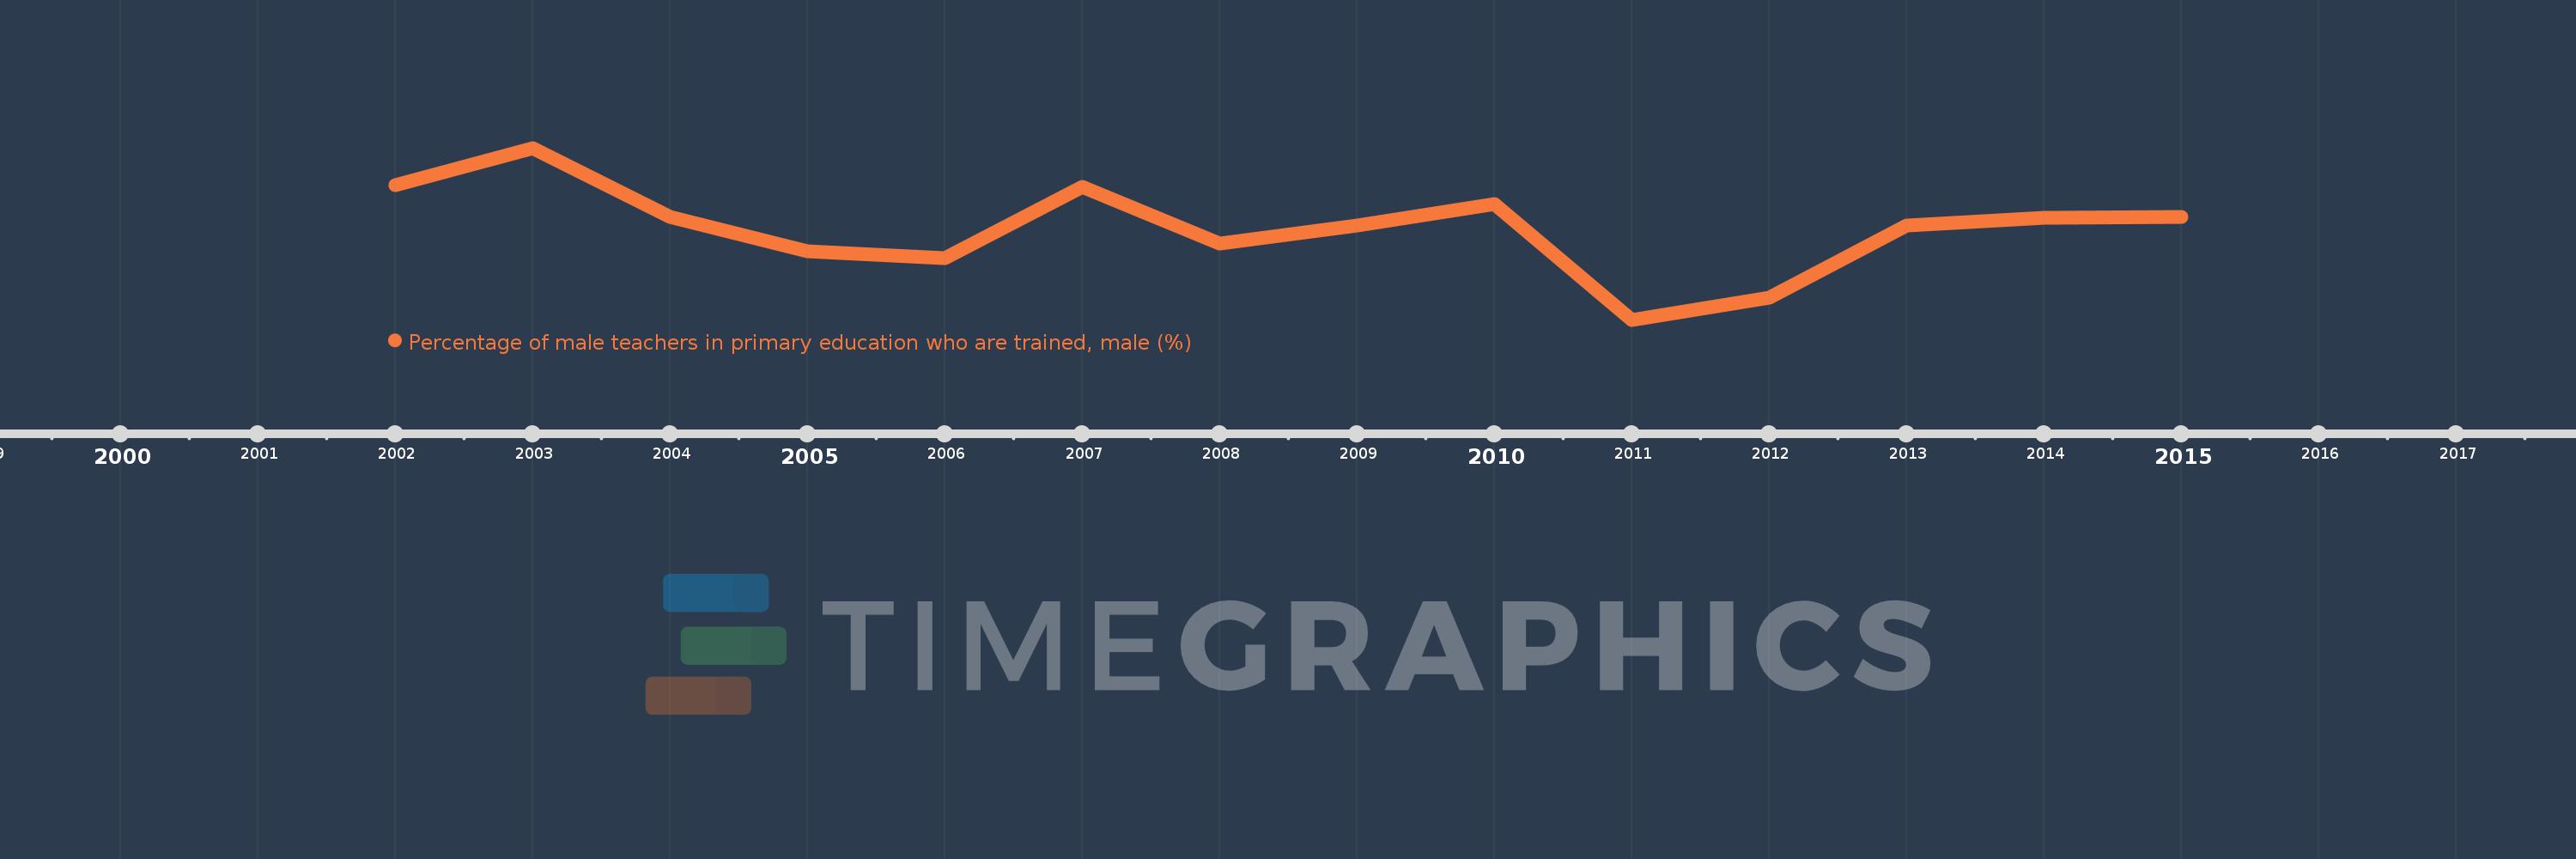
Percentage of male teachers in primary education who are trained, male (%)
2015,2014,2013,2012,2011,2010,2009,2008,2007,2006,2005,2004,2003,2002
Diese Statistik in anderen Ländern:
Zeitlinie:
Diese Zeitleiste vorliegt die Graphik ab 2002 J. bis 2015 J. Sub-Saharan Africa . Die Angaben bis 2001 J. sind nicht vorhanden. Die Zahl aktueller Beobachtungen nach Daten: 14.
Die Quelle (Bezeichnung):
Kennzahlen der Weltentwicklung
Die Quelle (Einrichtung):
United Nations Educational, Scientific, and Cultural Organization (UNESCO) Institute for Statistics.
Kategorien:
Education, Gender
Es wurde aktualisiert:
23 Apr 2017 Jahr
Kennzahlen der Wertänderungen vom Jahr zum Jahr
Minimum:
70.76
1 Jan 2011 Jahr
Maximum:
75.274
1 Jan 2003 Jahr
Zum Datum der Beobachtung
Wert
Absolute Veränderung
Die Veränderung bezüglich dem vorherigen Wert
1 Jan 2002 Jahr
74.29
+74.29
0.0%
1 Jan 2003 Jahr
75.274
+0.984
1.32%
1 Jan 2004 Jahr
73.471
-1.803
-2.4%
1 Jan 2005 Jahr
72.549
-0.922
-1.25%
1 Jan 2006 Jahr
72.369
-0.18
-0.25%
1 Jan 2007 Jahr
74.255
+1.886
2.61%
1 Jan 2008 Jahr
72.759
-1.497
-2.02%
1 Jan 2009 Jahr
73.231
+0.472
0.65%
1 Jan 2010 Jahr
73.794
+0.563
0.77%
1 Jan 2011 Jahr
70.76
-3.034
-4.11%
1 Jan 2012 Jahr
71.341
+0.581
0.82%
1 Jan 2013 Jahr
73.227
+1.886
2.64%
1 Jan 2014 Jahr
73.428
+0.201
0.27%
1 Jan 2015 Jahr
73.471
+0.043
0.06%
Bewertung der Länder gemäß mit laufender Statistik nach Jahren


Kommentare: