29
/de/
de
AIzaSyAYiBZKx7MnpbEhh9jyipgxe19OcubqV5w
April 1, 2024
110123
Congo, Dem. Rep.
COD
true
2
1
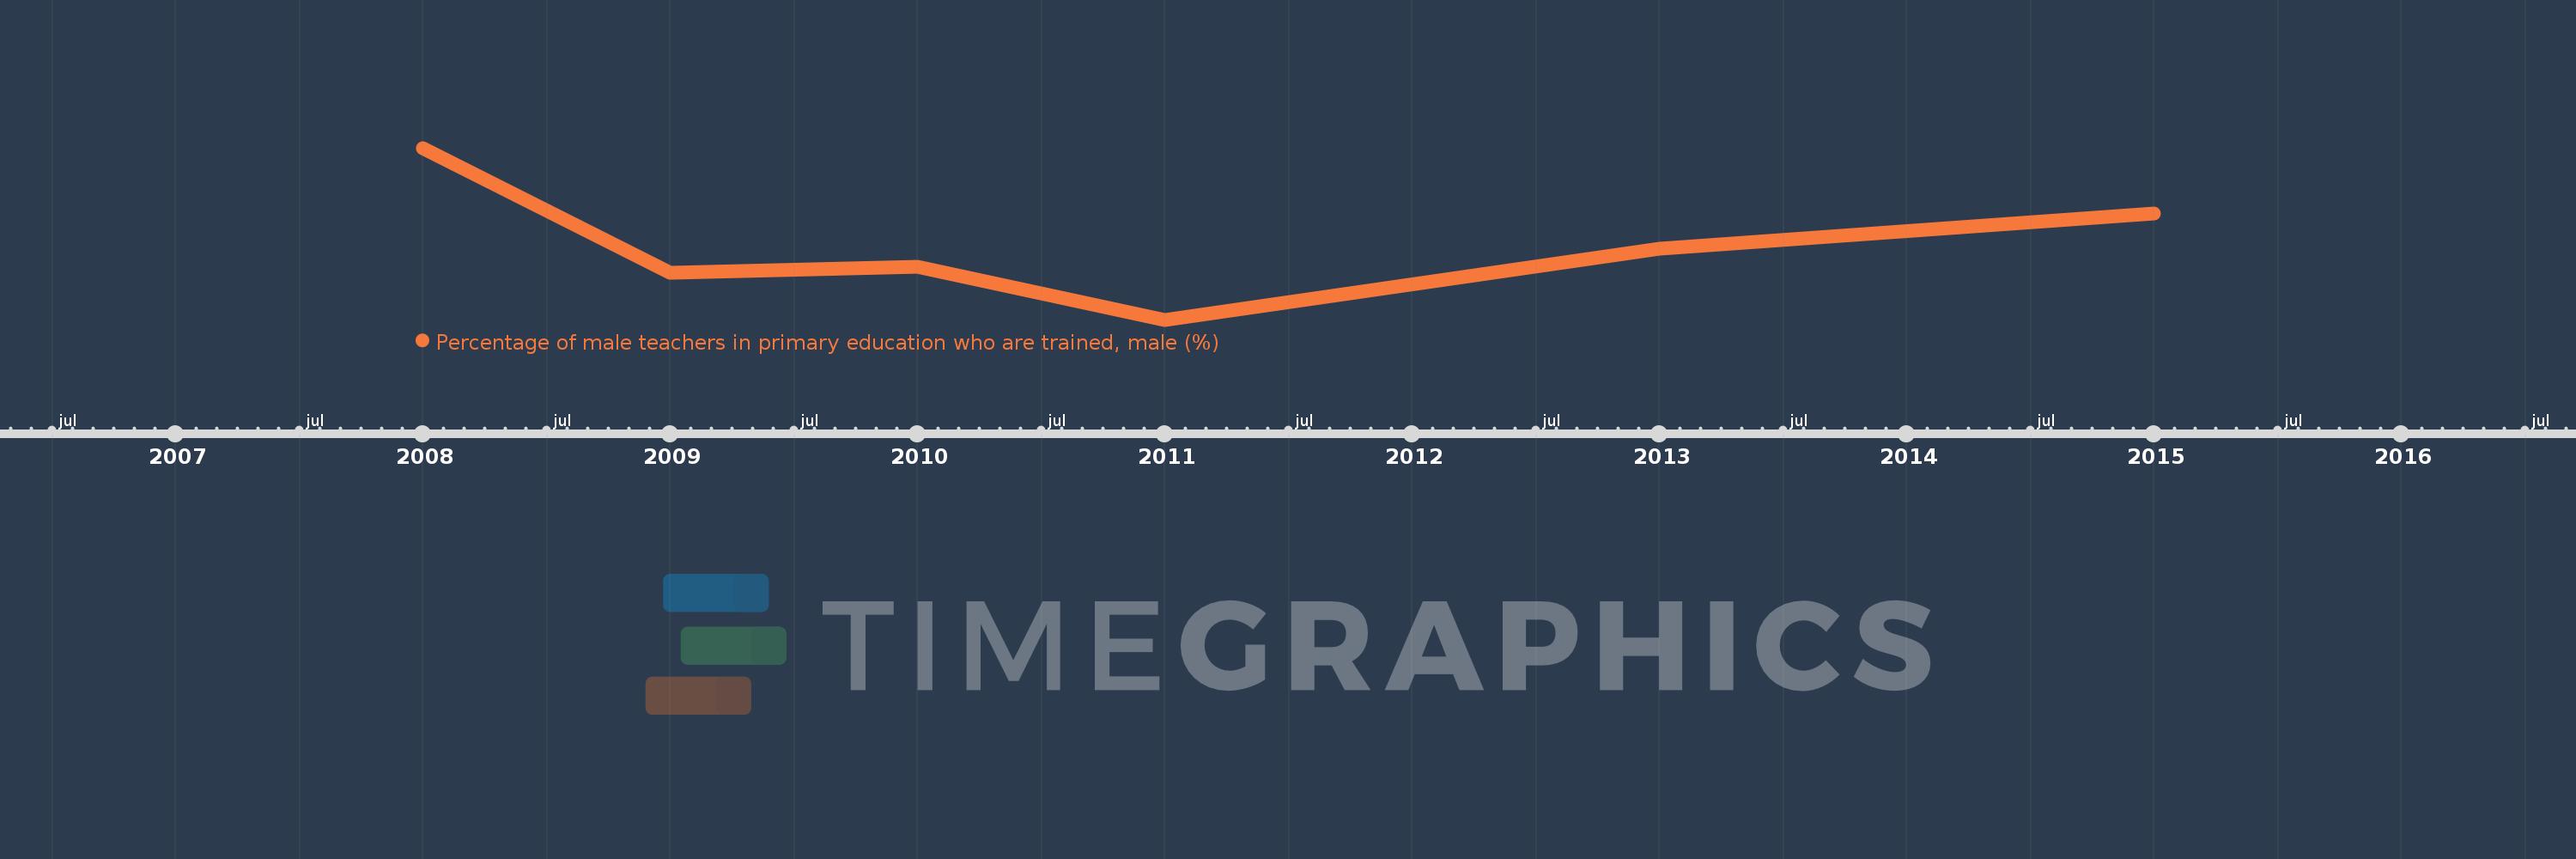
Percentage of male teachers in primary education who are trained, male (%)
2015,2013,2011,2010,2009,2008
Diese Statistik in anderen Ländern:
Zeitlinie:
Diese Zeitleiste vorliegt die Graphik ab 2008 J. bis 2015 J. Congo, Dem. Rep.. Die Angaben bis 2007 J. sind nicht vorhanden. Die Zahl aktueller Beobachtungen nach Daten: 6.
Die Quelle (Bezeichnung):
Kennzahlen der Weltentwicklung
Die Quelle (Einrichtung):
United Nations Educational, Scientific, and Cultural Organization (UNESCO) Institute for Statistics.
Kategorien:
Education, Gender
Es wurde aktualisiert:
23 Apr 2017 Jahr
Kennzahlen der Wertänderungen vom Jahr zum Jahr
Minimum:
91.008
1 Jan 2011 Jahr
Maximum:
96.544
1 Jan 2008 Jahr
Zum Datum der Beobachtung
Wert
Absolute Veränderung
Die Veränderung bezüglich dem vorherigen Wert
1 Jan 2008 Jahr
96.544
+96.544
0.0%
1 Jan 2009 Jahr
92.522
-4.022
-4.17%
1 Jan 2010 Jahr
92.706
+0.184
0.2%
1 Jan 2011 Jahr
91.008
-1.698
-1.83%
1 Jan 2013 Jahr
93.286
+2.278
2.5%
1 Jan 2015 Jahr
94.431
+1.145
1.23%
Bewertung der Länder gemäß mit laufender Statistik nach Jahren


Kommentare: