29
/de/
de
AIzaSyAYiBZKx7MnpbEhh9jyipgxe19OcubqV5w
April 1, 2024
39337
IDA only
IDX
false
2
1
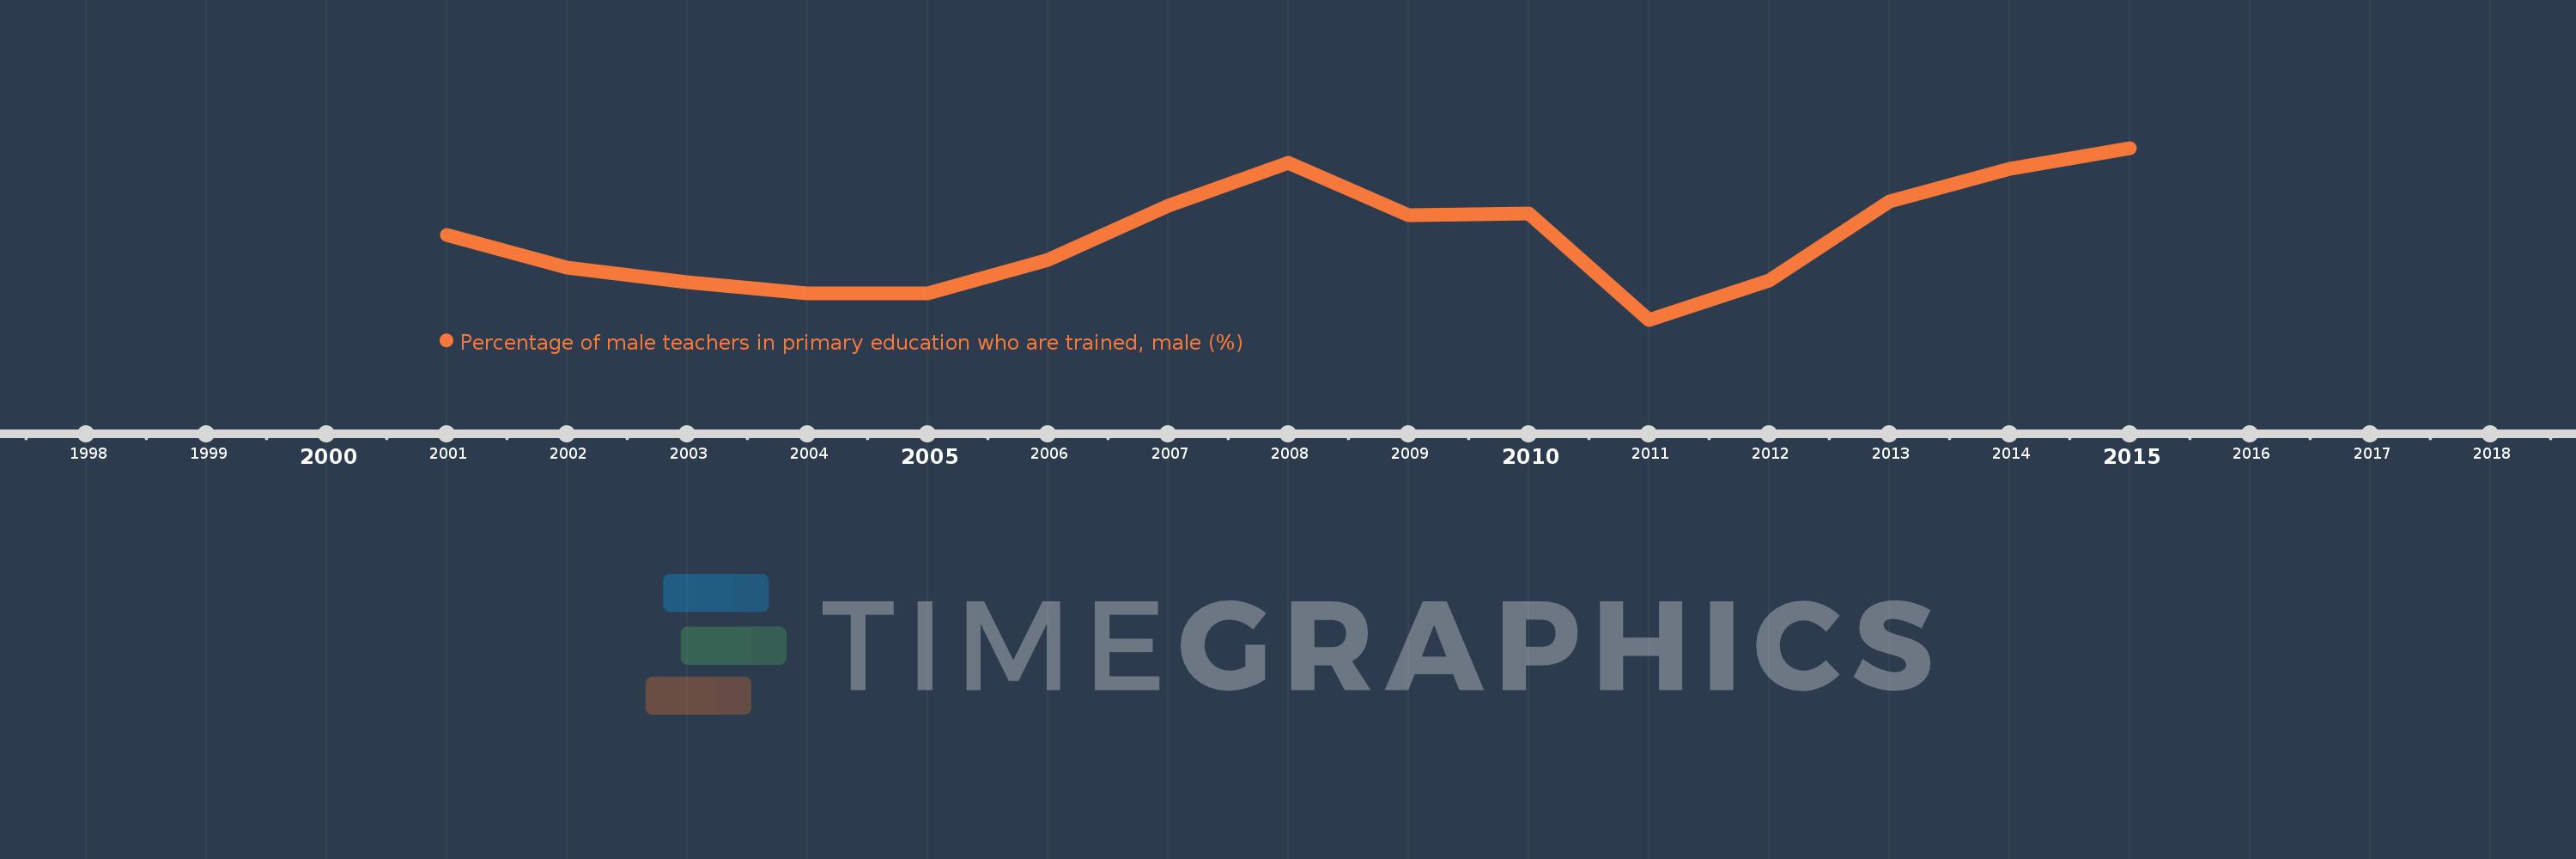
Percentage of male teachers in primary education who are trained, male (%)
2015,2014,2013,2012,2011,2010,2009,2008,2007,2006,2005,2004,2003,2002,2001
Diese Statistik in anderen Ländern:
Zeitlinie:
Diese Zeitleiste vorliegt die Graphik ab 2001 J. bis 2015 J. IDA only. Die Angaben bis 2000 J. sind nicht vorhanden. Die Zahl aktueller Beobachtungen nach Daten: 15.
Die Quelle (Bezeichnung):
Kennzahlen der Weltentwicklung
Die Quelle (Einrichtung):
United Nations Educational, Scientific, and Cultural Organization (UNESCO) Institute for Statistics.
Kategorien:
Education, Gender
Es wurde aktualisiert:
23 Apr 2017 Jahr
Kennzahlen der Wertänderungen vom Jahr zum Jahr
Minimum:
73.134
1 Jan 2011 Jahr
Maximum:
77.776
1 Jan 2015 Jahr
Zum Datum der Beobachtung
Wert
Absolute Veränderung
Die Veränderung bezüglich dem vorherigen Wert
1 Jan 2001 Jahr
75.436
+75.436
0.0%
1 Jan 2002 Jahr
74.54
-0.896
-1.19%
1 Jan 2003 Jahr
74.146
-0.394
-0.53%
1 Jan 2004 Jahr
73.839
-0.307
-0.41%
1 Jan 2005 Jahr
73.858
+0.019
0.03%
1 Jan 2006 Jahr
74.755
+0.897
1.21%
1 Jan 2007 Jahr
76.214
+1.459
1.95%
1 Jan 2008 Jahr
77.37
+1.156
1.52%
1 Jan 2009 Jahr
75.953
-1.418
-1.83%
1 Jan 2010 Jahr
76.009
+0.057
0.07%
1 Jan 2011 Jahr
73.134
-2.875
-3.78%
1 Jan 2012 Jahr
74.205
+1.071
1.46%
1 Jan 2013 Jahr
76.326
+2.12
2.86%
1 Jan 2014 Jahr
77.208
+0.882
1.16%
1 Jan 2015 Jahr
77.776
+0.568
0.74%
Bewertung der Länder gemäß mit laufender Statistik nach Jahren


Kommentare: