29
/de/
de
AIzaSyAYiBZKx7MnpbEhh9jyipgxe19OcubqV5w
April 1, 2024
250201
St. Kitts and Nevis
KNA
true
2
1
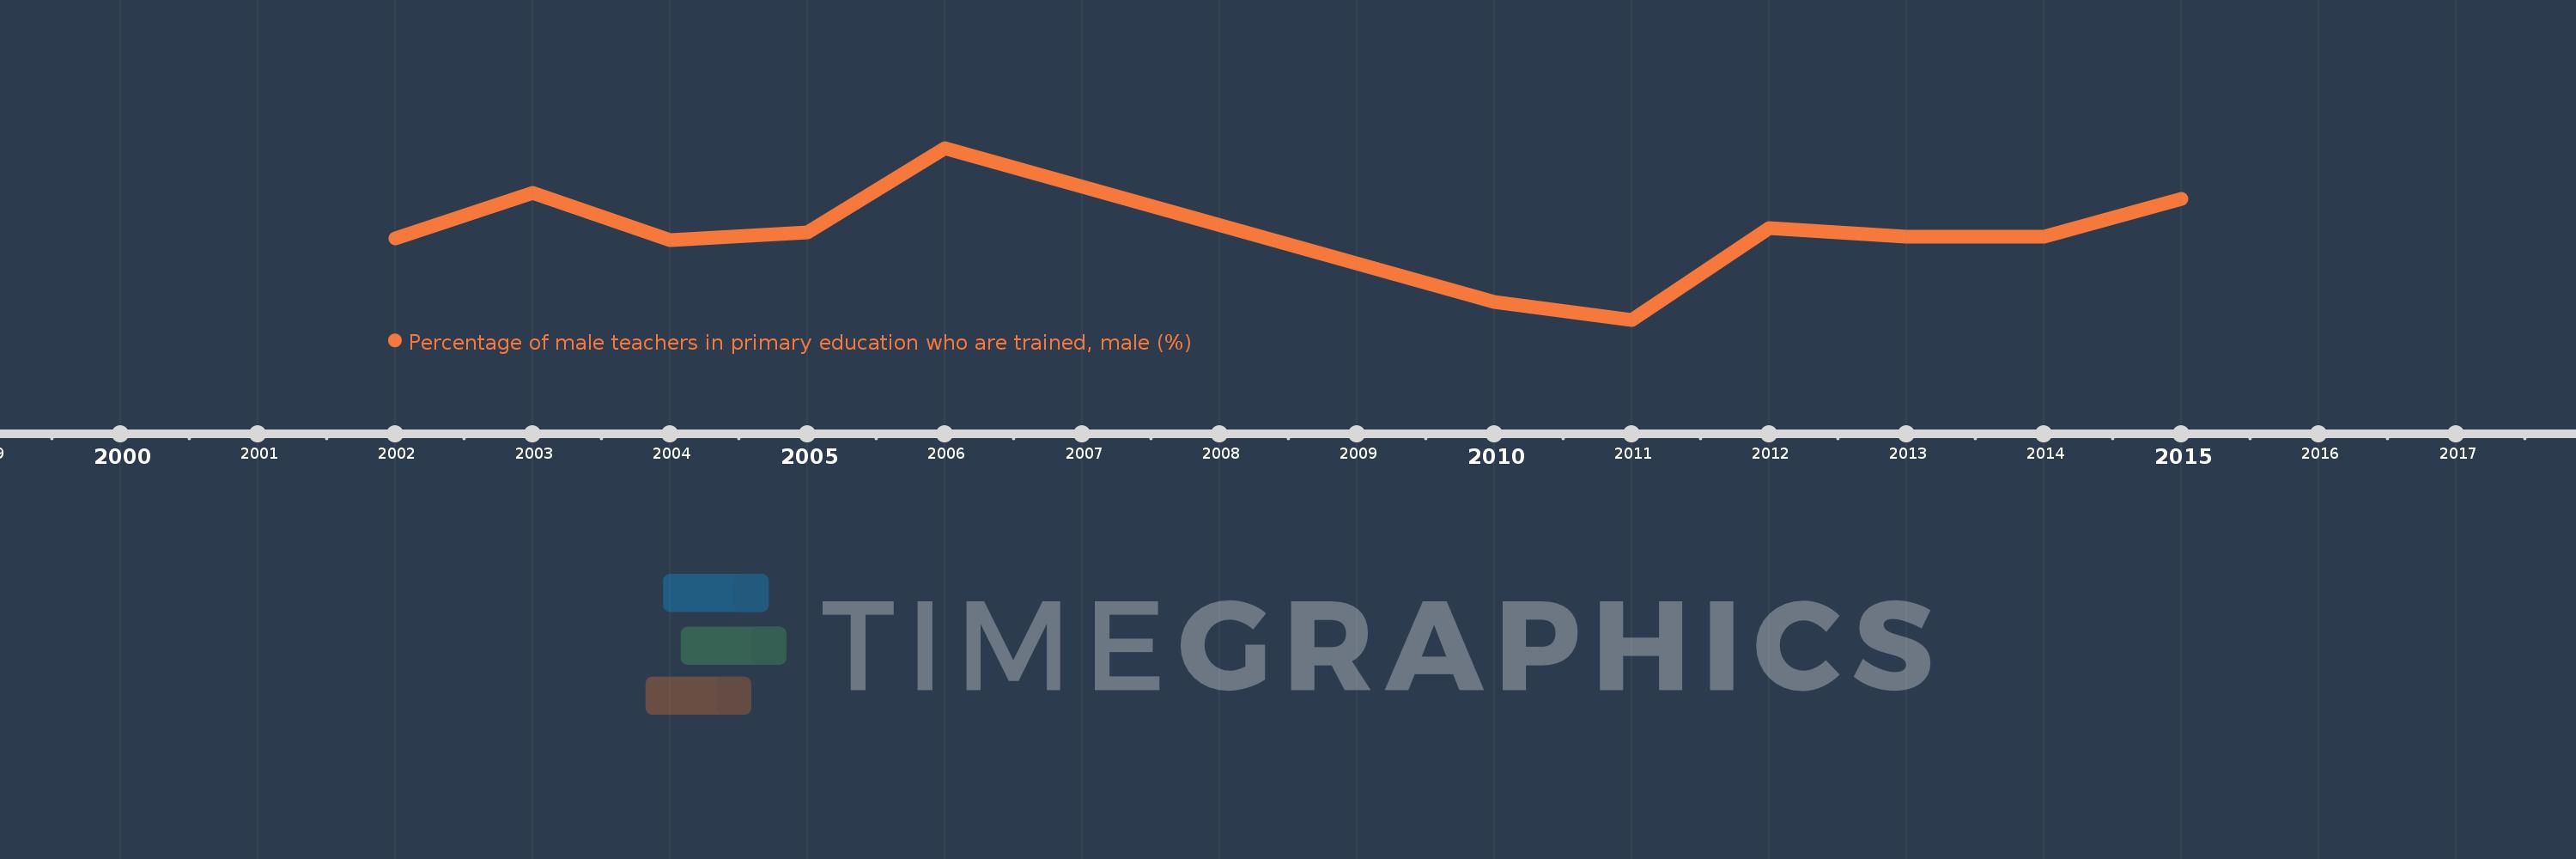
Percentage of male teachers in primary education who are trained, male (%)
2015,2014,2013,2012,2011,2010,2006,2005,2004,2003,2002
Diese Statistik in anderen Ländern:
Zeitlinie:
Diese Zeitleiste vorliegt die Graphik ab 2002 J. bis 2015 J. St. Kitts and Nevis. Die Angaben bis 2001 J. sind nicht vorhanden. Die Zahl aktueller Beobachtungen nach Daten: 11.
Die Quelle (Bezeichnung):
Kennzahlen der Weltentwicklung
Die Quelle (Einrichtung):
United Nations Educational, Scientific, and Cultural Organization (UNESCO) Institute for Statistics.
Kategorien:
Education, Gender
Es wurde aktualisiert:
23 Apr 2017 Jahr
Kennzahlen der Wertänderungen vom Jahr zum Jahr
Minimum:
44.068
1 Jan 2011 Jahr
Maximum:
66.667
1 Jan 2006 Jahr
Zum Datum der Beobachtung
Wert
Absolute Veränderung
Die Veränderung bezüglich dem vorherigen Wert
1 Jan 2002 Jahr
54.762
+54.762
0.0%
1 Jan 2003 Jahr
60.784
+6.022
11.0%
1 Jan 2004 Jahr
54.545
-6.239
-10.26%
1 Jan 2005 Jahr
55.556
+1.01
1.85%
1 Jan 2006 Jahr
66.667
+11.111
20.0%
1 Jan 2010 Jahr
46.429
-20.238
-30.36%
1 Jan 2011 Jahr
44.068
-2.361
-5.08%
1 Jan 2012 Jahr
56.14
+12.073
27.4%
1 Jan 2013 Jahr
55.0
-1.14
-2.03%
1 Jan 2014 Jahr
55.0
0.0
0.0%
1 Jan 2015 Jahr
60.0
+5.0
9.09%
Bewertung der Länder gemäß mit laufender Statistik nach Jahren


Kommentare: