29
/de/
de
AIzaSyAYiBZKx7MnpbEhh9jyipgxe19OcubqV5w
April 1, 2024
56703
Small states
SST
false
2
1
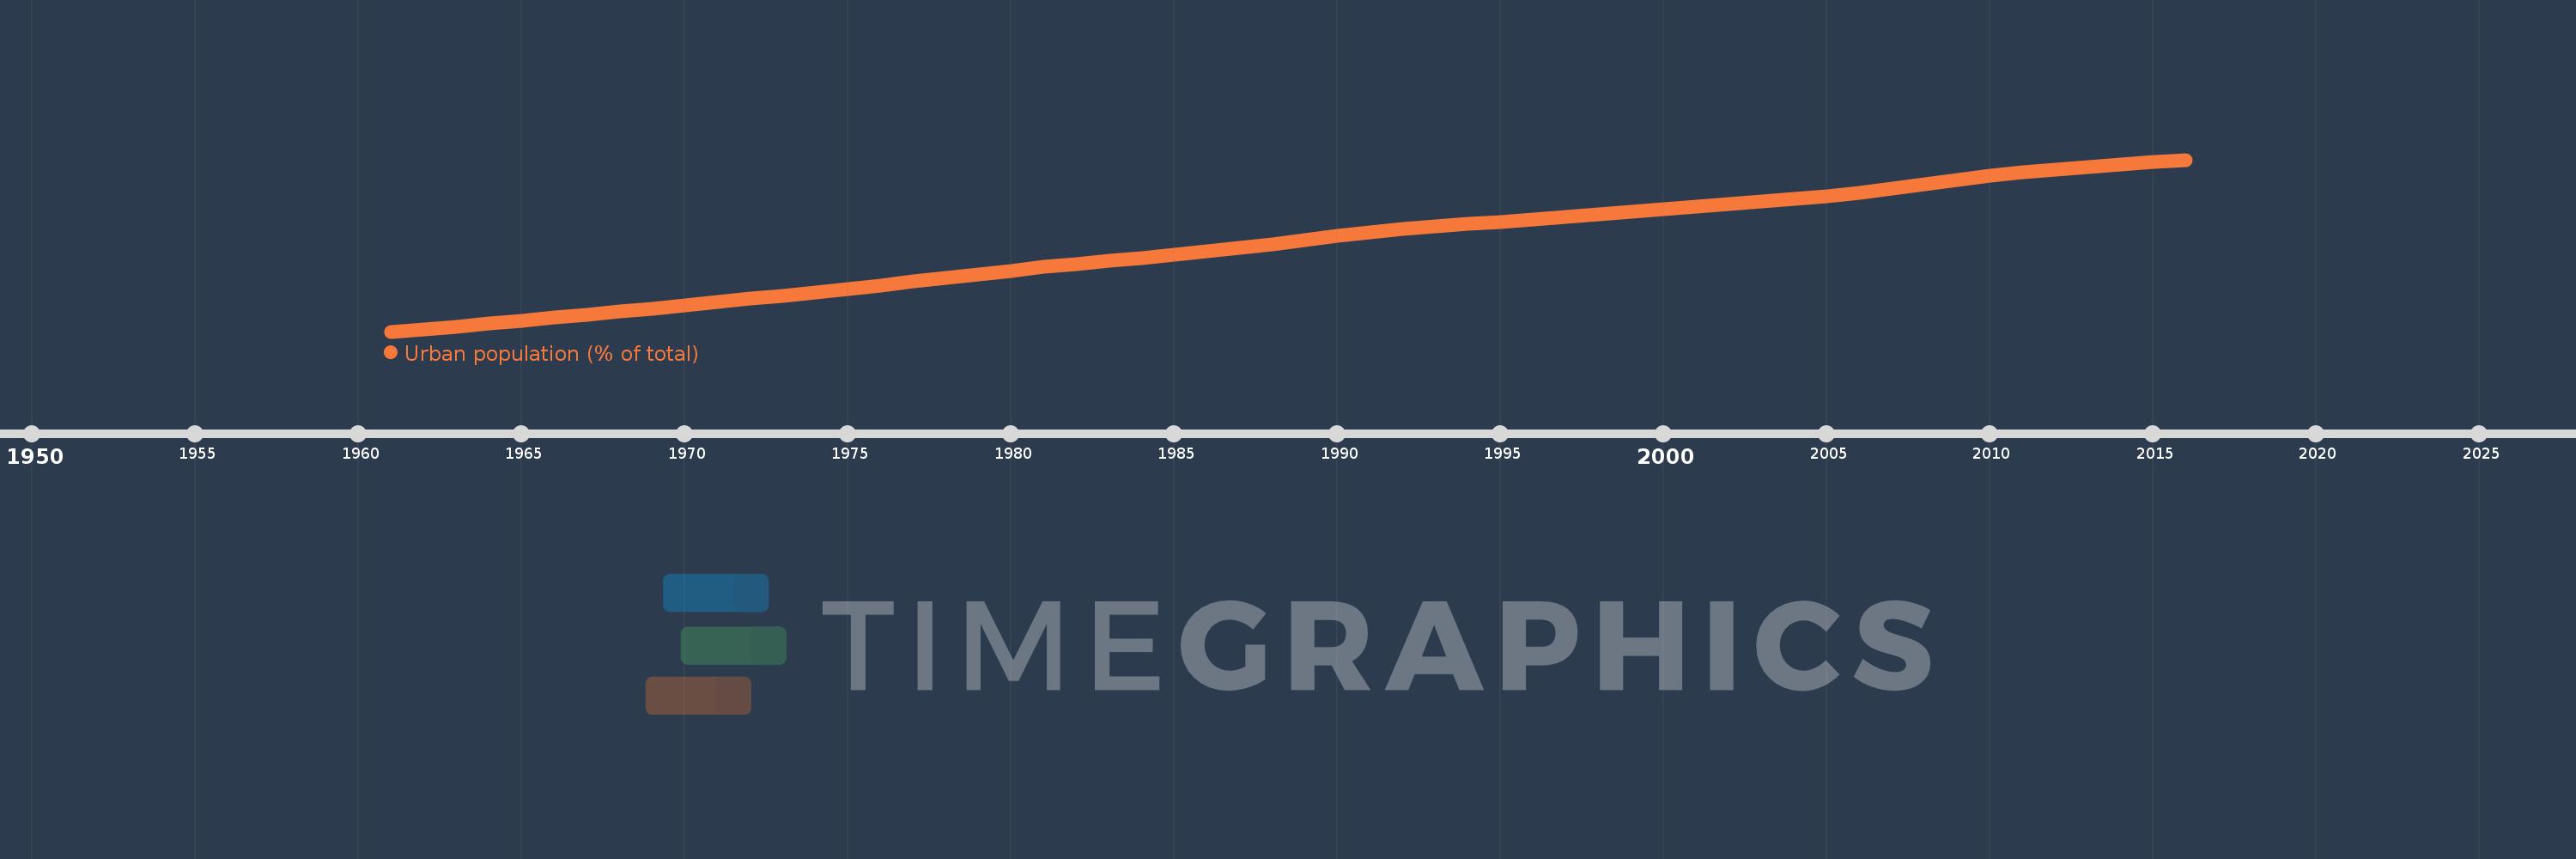
Urban population (% of total)
2016,2015,2014,2013,2012,2011,2010,2009,2008,2007,2006,2005,2004,2003,2002,2001,2000,1999,1998,1997,1996,1995,1994,1993,1992,1991,1990,1989,1988,1987,1986,1985,1984,1983,1982,1981,1980,1979,1978,1977,1976,1975,1974,1973,1972,1971,1970,1969,1968,1967,1966,1965,1964,1963,1962,1961
Diese Statistik in anderen Ländern:
AfghanistanAlbaniaAlgeriaAmerican SamoaAndorraAngolaAntigua and BarbudaArab WorldArgentinaArmeniaArubaAustraliaAustriaAzerbaijanBahamas, TheBahrainBangladeshBarbadosBelarusBelgiumBelizeBeninBermudaBhutanBoliviaBosnia and HerzegovinaBotswanaBrazilBritish Virgin IslandsBrunei DarussalamBulgariaBurkina FasoBurundiCabo VerdeCambodiaCameroonCanadaCaribbean small statesCayman IslandsCentral African RepublicCentral Europe and the BalticsChadChannel IslandsChileChinaColombiaComorosCongo, Dem. Rep.Congo, Rep.Costa RicaCote d'IvoireCroatiaCubaCuracaoCyprusCzech RepublicDenmarkDjiboutiDominicaDominican RepublicEarly-demographic dividendEast Asia & PacificEast Asia & Pacific (excluding high income)East Asia & Pacific (IDA & IBRD countries)EcuadorEgypt, Arab Rep.El SalvadorEquatorial GuineaEritreaEstoniaEthiopiaEuro areaEurope & Central AsiaEurope & Central Asia (excluding high income)Europe & Central Asia (IDA & IBRD countries)European UnionFaroe IslandsFijiFinlandFragile and conflict affected situationsFranceFrench PolynesiaGabonGambia, TheGeorgiaGermanyGhanaGibraltarGreeceGreenlandGrenadaGuamGuatemalaGuineaGuinea-BissauGuyanaHaitiHeavily indebted poor countries (HIPC)High incomeHondurasHong Kong SAR, ChinaHungaryIBRD onlyIcelandIDA & IBRD totalIDA blendIDA onlyIDA totalIndiaIndonesiaIran, Islamic Rep.IraqIrelandIsle of ManIsraelItalyJamaicaJapanJordanKazakhstanKenyaKiribatiKorea, Dem. People’s Rep.Korea, Rep.KuwaitKyrgyz RepublicLao PDRLate-demographic dividendLatin America & Caribbean Latin America & Caribbean (excluding high income)Latin America & the Caribbean (IDA & IBRD countries)LatviaLeast developed countries: UN classificationLebanonLesothoLiberiaLibyaLiechtensteinLithuaniaLow & middle incomeLow incomeLower middle incomeLuxembourgMacao SAR, ChinaMacedonia, FYRMadagascarMalawiMalaysiaMaldivesMaliMaltaMarshall IslandsMauritaniaMauritiusMexicoMicronesia, Fed. Sts.Middle East & North AfricaMiddle East & North Africa (excluding high income)Middle East & North Africa (IDA & IBRD countries)Middle incomeMoldovaMonacoMongoliaMontenegroMoroccoMozambiqueMyanmarNamibiaNauruNepalNetherlandsNew CaledoniaNew ZealandNicaraguaNigerNigeriaNorth AmericaNorthern Mariana IslandsNorwayOECD membersOmanOther small statesPacific island small statesPakistanPalauPanamaPapua New GuineaParaguayPeruPhilippinesPolandPortugalPost-demographic dividendPre-demographic dividendPuerto RicoQatarRomaniaRussian FederationRwandaSamoaSan MarinoSao Tome and PrincipeSaudi ArabiaSenegalSerbiaSeychellesSierra LeoneSingaporeSint Maarten (Dutch part)Slovak RepublicSloveniaSmall statesSolomon IslandsSomaliaSouth AfricaSouth AsiaSouth Asia (IDA & IBRD)South SudanSpainSri LankaSt. Kitts and NevisSt. LuciaSt. Vincent and the GrenadinesSub-Saharan Africa Sub-Saharan Africa (excluding high income)Sub-Saharan Africa (IDA & IBRD countries)SudanSurinameSwazilandSwedenSwitzerlandSyrian Arab RepublicTajikistanTanzaniaThailandTimor-LesteTogoTongaTrinidad and TobagoTunisiaTurkeyTurkmenistanTurks and Caicos IslandsTuvaluUgandaUkraineUnited Arab EmiratesUnited KingdomUnited StatesUpper middle incomeUruguayUzbekistanVanuatuVenezuela, RBVietnamVirgin Islands (U.S.)West Bank and GazaWorldYemen, Rep.ZambiaZimbabwe Zeitlinie:
Diese Zeitleiste vorliegt die Graphik ab 1961 J. bis 2016 J. Small states. Die Angaben bis 1960 J. sind nicht vorhanden. Die Zahl aktueller Beobachtungen nach Daten: 56.
Die Quelle (Bezeichnung):
Kennzahlen der Weltentwicklung
Die Quelle (Einrichtung):
United Nations, World Urbanization Prospects.
Kategorien:
Climate Change, Urban Development
Es wurde aktualisiert:
23 Apr 2017 Jahr
Kennzahlen der Wertänderungen vom Jahr zum Jahr
Minimum:
28.204
1 Jan 1961 Jahr
Maximum:
53.895
1 Jan 2016 Jahr
Zum Datum der Beobachtung
Wert
Absolute Veränderung
Die Veränderung bezüglich dem vorherigen Wert
1 Jan 1961 Jahr
28.204
+28.204
0.0%
1 Jan 1962 Jahr
28.565
+0.361
1.28%
1 Jan 1963 Jahr
28.949
+0.385
1.35%
1 Jan 1964 Jahr
29.375
+0.425
1.47%
1 Jan 1965 Jahr
29.829
+0.455
1.55%
1 Jan 1966 Jahr
30.299
+0.469
1.57%
1 Jan 1967 Jahr
30.769
+0.47
1.55%
1 Jan 1968 Jahr
31.204
+0.435
1.42%
1 Jan 1969 Jahr
31.656
+0.452
1.45%
1 Jan 1970 Jahr
32.122
+0.465
1.47%
1 Jan 1971 Jahr
32.598
+0.477
1.48%
1 Jan 1972 Jahr
33.093
+0.494
1.52%
1 Jan 1973 Jahr
33.585
+0.492
1.49%
1 Jan 1974 Jahr
34.058
+0.473
1.41%
1 Jan 1975 Jahr
34.577
+0.518
1.52%
1 Jan 1976 Jahr
35.122
+0.545
1.58%
1 Jan 1977 Jahr
35.683
+0.562
1.6%
1 Jan 1978 Jahr
36.227
+0.543
1.52%
1 Jan 1979 Jahr
36.773
+0.547
1.51%
1 Jan 1980 Jahr
37.307
+0.534
1.45%
1 Jan 1981 Jahr
37.84
+0.533
1.43%
1 Jan 1982 Jahr
38.311
+0.471
1.24%
1 Jan 1983 Jahr
38.805
+0.494
1.29%
1 Jan 1984 Jahr
39.229
+0.423
1.09%
1 Jan 1985 Jahr
39.68
+0.451
1.15%
1 Jan 1986 Jahr
40.17
+0.49
1.24%
1 Jan 1987 Jahr
40.71
+0.54
1.34%
1 Jan 1988 Jahr
41.291
+0.581
1.43%
1 Jan 1989 Jahr
41.893
+0.602
1.46%
1 Jan 1990 Jahr
42.488
+0.595
1.42%
1 Jan 1991 Jahr
43.068
+0.58
1.36%
1 Jan 1992 Jahr
43.606
+0.538
1.25%
1 Jan 1993 Jahr
43.975
+0.369
0.85%
1 Jan 1994 Jahr
44.3
+0.325
0.74%
1 Jan 1995 Jahr
44.639
+0.339
0.77%
1 Jan 1996 Jahr
44.976
+0.337
0.76%
1 Jan 1997 Jahr
45.346
+0.37
0.82%
1 Jan 1998 Jahr
45.725
+0.378
0.83%
1 Jan 1999 Jahr
46.109
+0.385
0.84%
1 Jan 2000 Jahr
46.504
+0.395
0.86%
1 Jan 2001 Jahr
46.924
+0.419
0.9%
1 Jan 2002 Jahr
47.315
+0.391
0.83%
1 Jan 2003 Jahr
47.665
+0.35
0.74%
1 Jan 2004 Jahr
48.037
+0.372
0.78%
1 Jan 2005 Jahr
48.462
+0.425
0.88%
1 Jan 2006 Jahr
48.977
+0.515
1.06%
1 Jan 2007 Jahr
49.564
+0.587
1.2%
1 Jan 2008 Jahr
50.202
+0.637
1.29%
1 Jan 2009 Jahr
50.856
+0.654
1.3%
1 Jan 2010 Jahr
51.473
+0.617
1.21%
1 Jan 2011 Jahr
52.014
+0.541
1.05%
1 Jan 2012 Jahr
52.459
+0.445
0.86%
1 Jan 2013 Jahr
52.861
+0.402
0.77%
1 Jan 2014 Jahr
53.22
+0.359
0.68%
1 Jan 2015 Jahr
53.56
+0.339
0.64%
1 Jan 2016 Jahr
53.895
+0.335
0.63%
Bewertung der Länder gemäß mit laufender Statistik nach Jahren


Kommentare: