29
/de/
de
AIzaSyAYiBZKx7MnpbEhh9jyipgxe19OcubqV5w
April 1, 2024
208989
New Caledonia
NCL
true
2
1
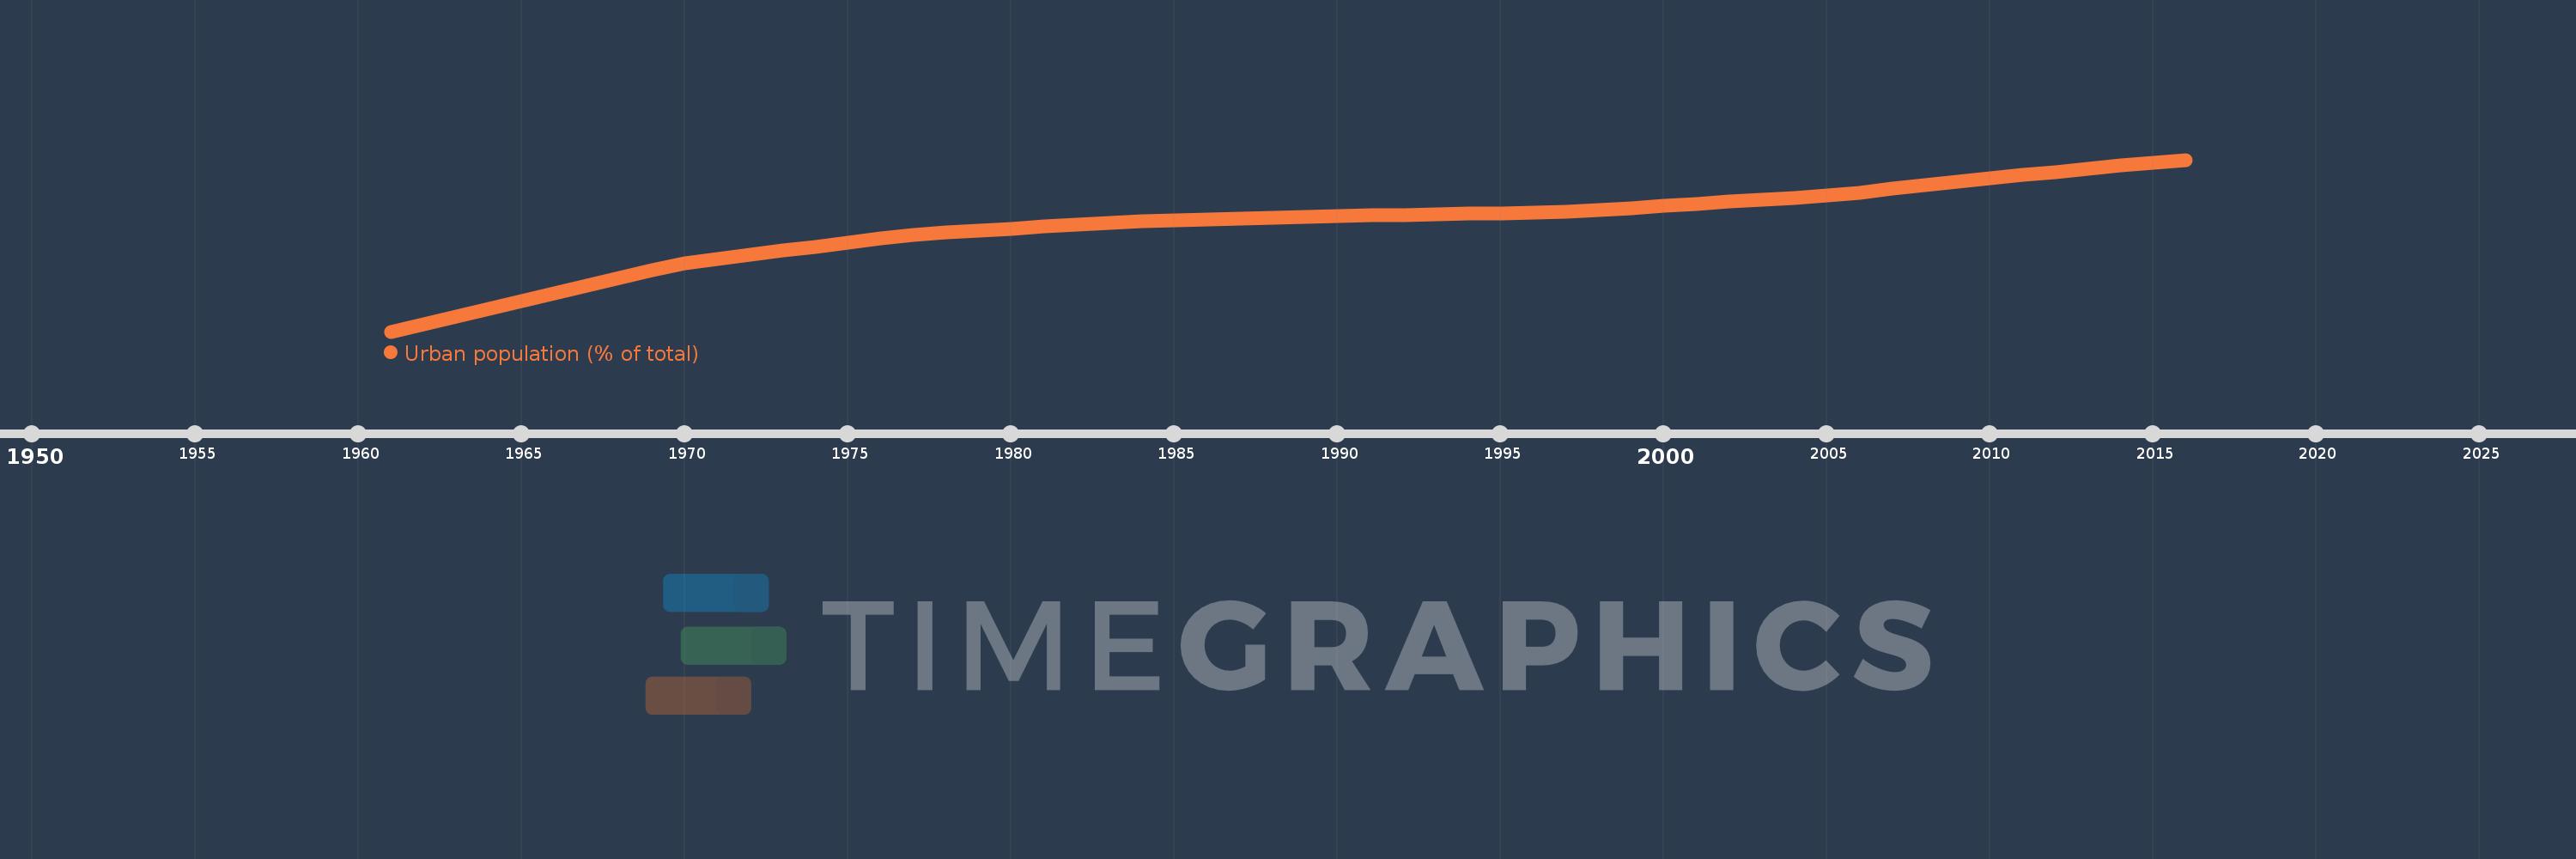
Urban population (% of total)
2016,2015,2014,2013,2012,2011,2010,2009,2008,2007,2006,2005,2004,2003,2002,2001,2000,1999,1998,1997,1996,1995,1994,1993,1992,1991,1990,1989,1988,1987,1986,1985,1984,1983,1982,1981,1980,1979,1978,1977,1976,1975,1974,1973,1972,1971,1970,1969,1968,1967,1966,1965,1964,1963,1962,1961
Diese Statistik in anderen Ländern:
AfghanistanAlbaniaAlgeriaAmerican SamoaAndorraAngolaAntigua and BarbudaArab WorldArgentinaArmeniaArubaAustraliaAustriaAzerbaijanBahamas, TheBahrainBangladeshBarbadosBelarusBelgiumBelizeBeninBermudaBhutanBoliviaBosnia and HerzegovinaBotswanaBrazilBritish Virgin IslandsBrunei DarussalamBulgariaBurkina FasoBurundiCabo VerdeCambodiaCameroonCanadaCaribbean small statesCayman IslandsCentral African RepublicCentral Europe and the BalticsChadChannel IslandsChileChinaColombiaComorosCongo, Dem. Rep.Congo, Rep.Costa RicaCote d'IvoireCroatiaCubaCuracaoCyprusCzech RepublicDenmarkDjiboutiDominicaDominican RepublicEarly-demographic dividendEast Asia & PacificEast Asia & Pacific (excluding high income)East Asia & Pacific (IDA & IBRD countries)EcuadorEgypt, Arab Rep.El SalvadorEquatorial GuineaEritreaEstoniaEthiopiaEuro areaEurope & Central AsiaEurope & Central Asia (excluding high income)Europe & Central Asia (IDA & IBRD countries)European UnionFaroe IslandsFijiFinlandFragile and conflict affected situationsFranceFrench PolynesiaGabonGambia, TheGeorgiaGermanyGhanaGibraltarGreeceGreenlandGrenadaGuamGuatemalaGuineaGuinea-BissauGuyanaHaitiHeavily indebted poor countries (HIPC)High incomeHondurasHong Kong SAR, ChinaHungaryIBRD onlyIcelandIDA & IBRD totalIDA blendIDA onlyIDA totalIndiaIndonesiaIran, Islamic Rep.IraqIrelandIsle of ManIsraelItalyJamaicaJapanJordanKazakhstanKenyaKiribatiKorea, Dem. People’s Rep.Korea, Rep.KuwaitKyrgyz RepublicLao PDRLate-demographic dividendLatin America & Caribbean Latin America & Caribbean (excluding high income)Latin America & the Caribbean (IDA & IBRD countries)LatviaLeast developed countries: UN classificationLebanonLesothoLiberiaLibyaLiechtensteinLithuaniaLow & middle incomeLow incomeLower middle incomeLuxembourgMacao SAR, ChinaMacedonia, FYRMadagascarMalawiMalaysiaMaldivesMaliMaltaMarshall IslandsMauritaniaMauritiusMexicoMicronesia, Fed. Sts.Middle East & North AfricaMiddle East & North Africa (excluding high income)Middle East & North Africa (IDA & IBRD countries)Middle incomeMoldovaMonacoMongoliaMontenegroMoroccoMozambiqueMyanmarNamibiaNauruNepalNetherlandsNew CaledoniaNew ZealandNicaraguaNigerNigeriaNorth AmericaNorthern Mariana IslandsNorwayOECD membersOmanOther small statesPacific island small statesPakistanPalauPanamaPapua New GuineaParaguayPeruPhilippinesPolandPortugalPost-demographic dividendPre-demographic dividendPuerto RicoQatarRomaniaRussian FederationRwandaSamoaSan MarinoSao Tome and PrincipeSaudi ArabiaSenegalSerbiaSeychellesSierra LeoneSingaporeSint Maarten (Dutch part)Slovak RepublicSloveniaSmall statesSolomon IslandsSomaliaSouth AfricaSouth AsiaSouth Asia (IDA & IBRD)South SudanSpainSri LankaSt. Kitts and NevisSt. LuciaSt. Vincent and the GrenadinesSub-Saharan Africa Sub-Saharan Africa (excluding high income)Sub-Saharan Africa (IDA & IBRD countries)SudanSurinameSwazilandSwedenSwitzerlandSyrian Arab RepublicTajikistanTanzaniaThailandTimor-LesteTogoTongaTrinidad and TobagoTunisiaTurkeyTurkmenistanTurks and Caicos IslandsTuvaluUgandaUkraineUnited Arab EmiratesUnited KingdomUnited StatesUpper middle incomeUruguayUzbekistanVanuatuVenezuela, RBVietnamVirgin Islands (U.S.)West Bank and GazaWorldYemen, Rep.ZambiaZimbabwe Zeitlinie:
Diese Zeitleiste vorliegt die Graphik ab 1961 J. bis 2016 J. New Caledonia. Die Angaben bis 1960 J. sind nicht vorhanden. Die Zahl aktueller Beobachtungen nach Daten: 56.
Die Quelle (Bezeichnung):
Kennzahlen der Weltentwicklung
Die Quelle (Einrichtung):
United Nations, World Urbanization Prospects.
Kategorien:
Climate Change, Urban Development
Es wurde aktualisiert:
23 Apr 2017 Jahr
Kennzahlen der Wertänderungen vom Jahr zum Jahr
Minimum:
37.36
1 Jan 1961 Jahr
Maximum:
70.21
1 Jan 2016 Jahr
Zum Datum der Beobachtung
Wert
Absolute Veränderung
Die Veränderung bezüglich dem vorherigen Wert
1 Jan 1961 Jahr
37.36
+37.36
0.0%
1 Jan 1962 Jahr
38.781
+1.421
3.8%
1 Jan 1963 Jahr
40.224
+1.443
3.72%
1 Jan 1964 Jahr
41.684
+1.46
3.63%
1 Jan 1965 Jahr
43.161
+1.477
3.54%
1 Jan 1966 Jahr
44.646
+1.485
3.44%
1 Jan 1967 Jahr
46.142
+1.496
3.35%
1 Jan 1968 Jahr
47.646
+1.504
3.26%
1 Jan 1969 Jahr
49.156
+1.51
3.17%
1 Jan 1970 Jahr
50.442
+1.286
2.62%
1 Jan 1971 Jahr
51.232
+0.79
1.57%
1 Jan 1972 Jahr
52.022
+0.79
1.54%
1 Jan 1973 Jahr
52.811
+0.789
1.52%
1 Jan 1974 Jahr
53.597
+0.786
1.49%
1 Jan 1975 Jahr
54.382
+0.785
1.46%
1 Jan 1976 Jahr
55.165
+0.783
1.44%
1 Jan 1977 Jahr
55.873
+0.708
1.28%
1 Jan 1978 Jahr
56.262
+0.389
0.7%
1 Jan 1979 Jahr
56.651
+0.389
0.69%
1 Jan 1980 Jahr
57.039
+0.388
0.68%
1 Jan 1981 Jahr
57.426
+0.387
0.68%
1 Jan 1982 Jahr
57.812
+0.386
0.67%
1 Jan 1983 Jahr
58.197
+0.385
0.67%
1 Jan 1984 Jahr
58.532
+0.335
0.58%
1 Jan 1985 Jahr
58.683
+0.151
0.26%
1 Jan 1986 Jahr
58.834
+0.151
0.26%
1 Jan 1987 Jahr
58.985
+0.151
0.26%
1 Jan 1988 Jahr
59.135
+0.15
0.25%
1 Jan 1989 Jahr
59.286
+0.151
0.26%
1 Jan 1990 Jahr
59.427
+0.141
0.24%
1 Jan 1991 Jahr
59.537
+0.11
0.19%
1 Jan 1992 Jahr
59.648
+0.111
0.19%
1 Jan 1993 Jahr
59.759
+0.111
0.19%
1 Jan 1994 Jahr
59.869
+0.11
0.18%
1 Jan 1995 Jahr
59.979
+0.11
0.18%
1 Jan 1996 Jahr
60.09
+0.111
0.19%
1 Jan 1997 Jahr
60.2
+0.11
0.18%
1 Jan 1998 Jahr
60.597
+0.397
0.66%
1 Jan 1999 Jahr
60.992
+0.395
0.65%
1 Jan 2000 Jahr
61.387
+0.395
0.65%
1 Jan 2001 Jahr
61.78
+0.393
0.64%
1 Jan 2002 Jahr
62.171
+0.391
0.63%
1 Jan 2003 Jahr
62.561
+0.39
0.63%
1 Jan 2004 Jahr
62.949
+0.388
0.62%
1 Jan 2005 Jahr
63.336
+0.387
0.61%
1 Jan 2006 Jahr
63.965
+0.629
0.99%
1 Jan 2007 Jahr
64.638
+0.673
1.05%
1 Jan 2008 Jahr
65.306
+0.668
1.03%
1 Jan 2009 Jahr
65.969
+0.663
1.02%
1 Jan 2010 Jahr
66.624
+0.655
0.99%
1 Jan 2011 Jahr
67.273
+0.649
0.97%
1 Jan 2012 Jahr
67.901
+0.628
0.93%
1 Jan 2013 Jahr
68.509
+0.608
0.9%
1 Jan 2014 Jahr
69.096
+0.587
0.86%
1 Jan 2015 Jahr
69.663
+0.567
0.82%
1 Jan 2016 Jahr
70.21
+0.547
0.79%
Bewertung der Länder gemäß mit laufender Statistik nach Jahren


Kommentare: