29
/de/
de
AIzaSyAYiBZKx7MnpbEhh9jyipgxe19OcubqV5w
April 1, 2024
243263
Slovenia
SVN
true
2
1
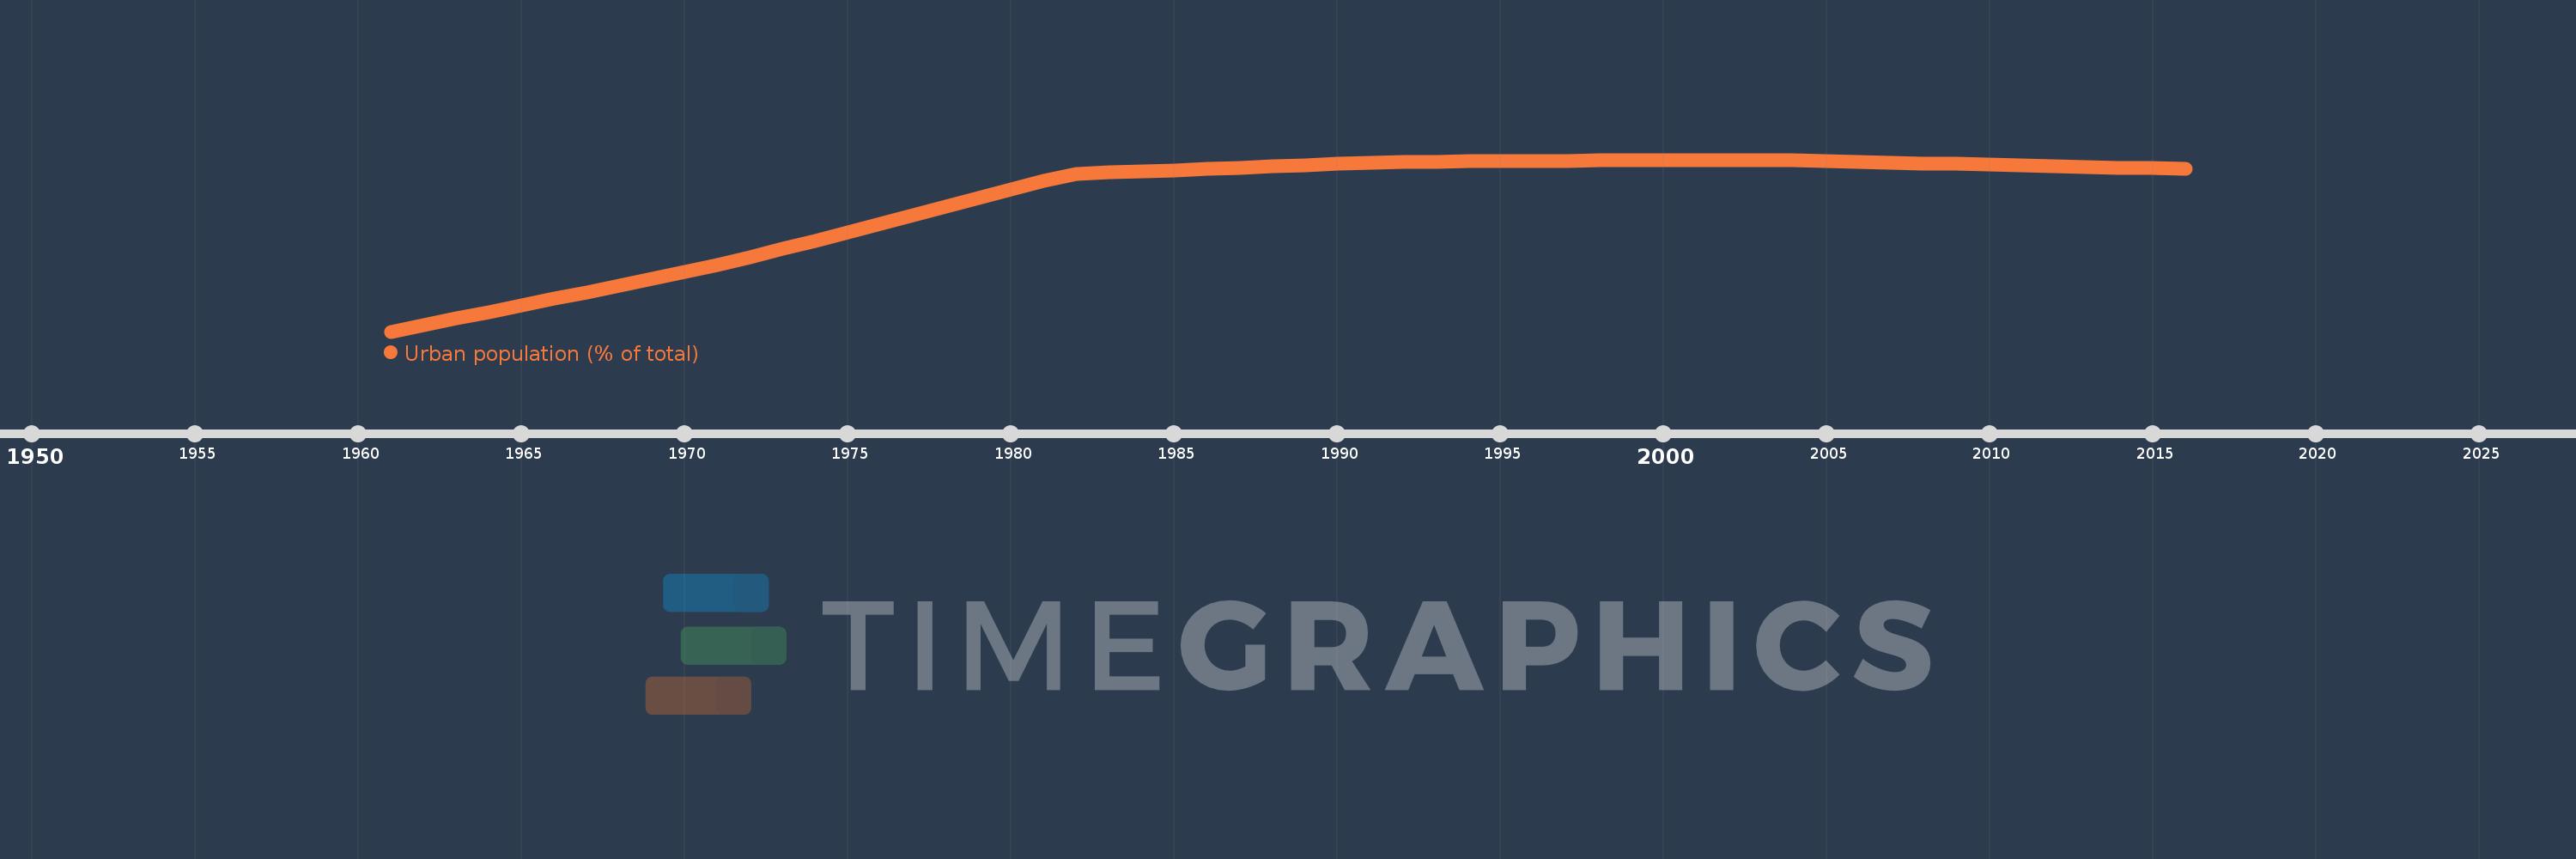
Urban population (% of total)
2016,2015,2014,2013,2012,2011,2010,2009,2008,2007,2006,2005,2004,2003,2002,2001,2000,1999,1998,1997,1996,1995,1994,1993,1992,1991,1990,1989,1988,1987,1986,1985,1984,1983,1982,1981,1980,1979,1978,1977,1976,1975,1974,1973,1972,1971,1970,1969,1968,1967,1966,1965,1964,1963,1962,1961
Diese Statistik in anderen Ländern:
AfghanistanAlbaniaAlgeriaAmerican SamoaAndorraAngolaAntigua and BarbudaArab WorldArgentinaArmeniaArubaAustraliaAustriaAzerbaijanBahamas, TheBahrainBangladeshBarbadosBelarusBelgiumBelizeBeninBermudaBhutanBoliviaBosnia and HerzegovinaBotswanaBrazilBritish Virgin IslandsBrunei DarussalamBulgariaBurkina FasoBurundiCabo VerdeCambodiaCameroonCanadaCaribbean small statesCayman IslandsCentral African RepublicCentral Europe and the BalticsChadChannel IslandsChileChinaColombiaComorosCongo, Dem. Rep.Congo, Rep.Costa RicaCote d'IvoireCroatiaCubaCuracaoCyprusCzech RepublicDenmarkDjiboutiDominicaDominican RepublicEarly-demographic dividendEast Asia & PacificEast Asia & Pacific (excluding high income)East Asia & Pacific (IDA & IBRD countries)EcuadorEgypt, Arab Rep.El SalvadorEquatorial GuineaEritreaEstoniaEthiopiaEuro areaEurope & Central AsiaEurope & Central Asia (excluding high income)Europe & Central Asia (IDA & IBRD countries)European UnionFaroe IslandsFijiFinlandFragile and conflict affected situationsFranceFrench PolynesiaGabonGambia, TheGeorgiaGermanyGhanaGibraltarGreeceGreenlandGrenadaGuamGuatemalaGuineaGuinea-BissauGuyanaHaitiHeavily indebted poor countries (HIPC)High incomeHondurasHong Kong SAR, ChinaHungaryIBRD onlyIcelandIDA & IBRD totalIDA blendIDA onlyIDA totalIndiaIndonesiaIran, Islamic Rep.IraqIrelandIsle of ManIsraelItalyJamaicaJapanJordanKazakhstanKenyaKiribatiKorea, Dem. People’s Rep.Korea, Rep.KuwaitKyrgyz RepublicLao PDRLate-demographic dividendLatin America & Caribbean Latin America & Caribbean (excluding high income)Latin America & the Caribbean (IDA & IBRD countries)LatviaLeast developed countries: UN classificationLebanonLesothoLiberiaLibyaLiechtensteinLithuaniaLow & middle incomeLow incomeLower middle incomeLuxembourgMacao SAR, ChinaMacedonia, FYRMadagascarMalawiMalaysiaMaldivesMaliMaltaMarshall IslandsMauritaniaMauritiusMexicoMicronesia, Fed. Sts.Middle East & North AfricaMiddle East & North Africa (excluding high income)Middle East & North Africa (IDA & IBRD countries)Middle incomeMoldovaMonacoMongoliaMontenegroMoroccoMozambiqueMyanmarNamibiaNauruNepalNetherlandsNew CaledoniaNew ZealandNicaraguaNigerNigeriaNorth AmericaNorthern Mariana IslandsNorwayOECD membersOmanOther small statesPacific island small statesPakistanPalauPanamaPapua New GuineaParaguayPeruPhilippinesPolandPortugalPost-demographic dividendPre-demographic dividendPuerto RicoQatarRomaniaRussian FederationRwandaSamoaSan MarinoSao Tome and PrincipeSaudi ArabiaSenegalSerbiaSeychellesSierra LeoneSingaporeSint Maarten (Dutch part)Slovak RepublicSloveniaSmall statesSolomon IslandsSomaliaSouth AfricaSouth AsiaSouth Asia (IDA & IBRD)South SudanSpainSri LankaSt. Kitts and NevisSt. LuciaSt. Vincent and the GrenadinesSub-Saharan Africa Sub-Saharan Africa (excluding high income)Sub-Saharan Africa (IDA & IBRD countries)SudanSurinameSwazilandSwedenSwitzerlandSyrian Arab RepublicTajikistanTanzaniaThailandTimor-LesteTogoTongaTrinidad and TobagoTunisiaTurkeyTurkmenistanTurks and Caicos IslandsTuvaluUgandaUkraineUnited Arab EmiratesUnited KingdomUnited StatesUpper middle incomeUruguayUzbekistanVanuatuVenezuela, RBVietnamVirgin Islands (U.S.)West Bank and GazaWorldYemen, Rep.ZambiaZimbabwe Zeitlinie:
Diese Zeitleiste vorliegt die Graphik ab 1961 J. bis 2016 J. Slovenia. Die Angaben bis 1960 J. sind nicht vorhanden. Die Zahl aktueller Beobachtungen nach Daten: 56.
Die Quelle (Bezeichnung):
Kennzahlen der Weltentwicklung
Die Quelle (Einrichtung):
United Nations, World Urbanization Prospects.
Kategorien:
Climate Change, Urban Development
Es wurde aktualisiert:
23 Apr 2017 Jahr
Kennzahlen der Wertänderungen vom Jahr zum Jahr
Minimum:
28.204
1 Jan 1961 Jahr
Maximum:
50.78
1 Jan 2002 Jahr
Zum Datum der Beobachtung
Wert
Absolute Veränderung
Die Veränderung bezüglich dem vorherigen Wert
1 Jan 1961 Jahr
28.204
+28.204
0.0%
1 Jan 1962 Jahr
29.107
+0.903
3.2%
1 Jan 1963 Jahr
29.934
+0.827
2.84%
1 Jan 1964 Jahr
30.776
+0.842
2.81%
1 Jan 1965 Jahr
31.631
+0.855
2.78%
1 Jan 1966 Jahr
32.497
+0.866
2.74%
1 Jan 1967 Jahr
33.376
+0.879
2.7%
1 Jan 1968 Jahr
34.266
+0.89
2.67%
1 Jan 1969 Jahr
35.169
+0.903
2.64%
1 Jan 1970 Jahr
36.081
+0.912
2.59%
1 Jan 1971 Jahr
37.004
+0.923
2.56%
1 Jan 1972 Jahr
37.972
+0.968
2.62%
1 Jan 1973 Jahr
39.058
+1.086
2.86%
1 Jan 1974 Jahr
40.153
+1.095
2.8%
1 Jan 1975 Jahr
41.259
+1.106
2.75%
1 Jan 1976 Jahr
42.374
+1.115
2.7%
1 Jan 1977 Jahr
43.499
+1.125
2.65%
1 Jan 1978 Jahr
44.627
+1.128
2.59%
1 Jan 1979 Jahr
45.762
+1.135
2.54%
1 Jan 1980 Jahr
46.901
+1.139
2.49%
1 Jan 1981 Jahr
48.045
+1.144
2.44%
1 Jan 1982 Jahr
48.94
+0.895
1.86%
1 Jan 1983 Jahr
49.1
+0.16
0.33%
1 Jan 1984 Jahr
49.26
+0.16
0.33%
1 Jan 1985 Jahr
49.42
+0.16
0.32%
1 Jan 1986 Jahr
49.58
+0.16
0.32%
1 Jan 1987 Jahr
49.74
+0.16
0.32%
1 Jan 1988 Jahr
49.9
+0.16
0.32%
1 Jan 1989 Jahr
50.061
+0.161
0.32%
1 Jan 1990 Jahr
50.22
+0.159
0.32%
1 Jan 1991 Jahr
50.38
+0.16
0.32%
1 Jan 1992 Jahr
50.507
+0.127
0.25%
1 Jan 1993 Jahr
50.534
+0.027
0.05%
1 Jan 1994 Jahr
50.561
+0.027
0.05%
1 Jan 1995 Jahr
50.589
+0.028
0.06%
1 Jan 1996 Jahr
50.616
+0.027
0.05%
1 Jan 1997 Jahr
50.643
+0.027
0.05%
1 Jan 1998 Jahr
50.671
+0.028
0.06%
1 Jan 1999 Jahr
50.698
+0.027
0.05%
1 Jan 2000 Jahr
50.725
+0.027
0.05%
1 Jan 2001 Jahr
50.752
+0.027
0.05%
1 Jan 2002 Jahr
50.78
+0.028
0.06%
1 Jan 2003 Jahr
50.777
-0.003
-0.01%
1 Jan 2004 Jahr
50.685
-0.092
-0.18%
1 Jan 2005 Jahr
50.593
-0.092
-0.18%
1 Jan 2006 Jahr
50.501
-0.092
-0.18%
1 Jan 2007 Jahr
50.409
-0.092
-0.18%
1 Jan 2008 Jahr
50.317
-0.092
-0.18%
1 Jan 2009 Jahr
50.224
-0.093
-0.18%
1 Jan 2010 Jahr
50.133
-0.091
-0.18%
1 Jan 2011 Jahr
50.04
-0.093
-0.19%
1 Jan 2012 Jahr
49.948
-0.092
-0.18%
1 Jan 2013 Jahr
49.856
-0.092
-0.18%
1 Jan 2014 Jahr
49.764
-0.092
-0.18%
1 Jan 2015 Jahr
49.695
-0.069
-0.14%
1 Jan 2016 Jahr
49.65
-0.045
-0.09%
Bewertung der Länder gemäß mit laufender Statistik nach Jahren


Kommentare: