29
/de/
de
AIzaSyAYiBZKx7MnpbEhh9jyipgxe19OcubqV5w
April 1, 2024
280518
Vanuatu
VUT
true
2
1
Urban population (% of total)
2016,2015,2014,2013,2012,2011,2010,2009,2008,2007,2006,2005,2004,2003,2002,2001,2000,1999,1998,1997,1996,1995,1994,1993,1992,1991,1990,1989,1988,1987,1986,1985,1984,1983,1982,1981,1980,1979,1978,1977,1976,1975,1974,1973,1972,1971,1970,1969,1968,1967,1966,1965,1964,1963,1962,1961
Diese Statistik in anderen Ländern:
AfghanistanAlbaniaAlgeriaAmerican SamoaAndorraAngolaAntigua and BarbudaArab WorldArgentinaArmeniaArubaAustraliaAustriaAzerbaijanBahamas, TheBahrainBangladeshBarbadosBelarusBelgiumBelizeBeninBermudaBhutanBoliviaBosnia and HerzegovinaBotswanaBrazilBritish Virgin IslandsBrunei DarussalamBulgariaBurkina FasoBurundiCabo VerdeCambodiaCameroonCanadaCaribbean small statesCayman IslandsCentral African RepublicCentral Europe and the BalticsChadChannel IslandsChileChinaColombiaComorosCongo, Dem. Rep.Congo, Rep.Costa RicaCote d'IvoireCroatiaCubaCuracaoCyprusCzech RepublicDenmarkDjiboutiDominicaDominican RepublicEarly-demographic dividendEast Asia & PacificEast Asia & Pacific (excluding high income)East Asia & Pacific (IDA & IBRD countries)EcuadorEgypt, Arab Rep.El SalvadorEquatorial GuineaEritreaEstoniaEthiopiaEuro areaEurope & Central AsiaEurope & Central Asia (excluding high income)Europe & Central Asia (IDA & IBRD countries)European UnionFaroe IslandsFijiFinlandFragile and conflict affected situationsFranceFrench PolynesiaGabonGambia, TheGeorgiaGermanyGhanaGibraltarGreeceGreenlandGrenadaGuamGuatemalaGuineaGuinea-BissauGuyanaHaitiHeavily indebted poor countries (HIPC)High incomeHondurasHong Kong SAR, ChinaHungaryIBRD onlyIcelandIDA & IBRD totalIDA blendIDA onlyIDA totalIndiaIndonesiaIran, Islamic Rep.IraqIrelandIsle of ManIsraelItalyJamaicaJapanJordanKazakhstanKenyaKiribatiKorea, Dem. People’s Rep.Korea, Rep.KuwaitKyrgyz RepublicLao PDRLate-demographic dividendLatin America & Caribbean Latin America & Caribbean (excluding high income)Latin America & the Caribbean (IDA & IBRD countries)LatviaLeast developed countries: UN classificationLebanonLesothoLiberiaLibyaLiechtensteinLithuaniaLow & middle incomeLow incomeLower middle incomeLuxembourgMacao SAR, ChinaMacedonia, FYRMadagascarMalawiMalaysiaMaldivesMaliMaltaMarshall IslandsMauritaniaMauritiusMexicoMicronesia, Fed. Sts.Middle East & North AfricaMiddle East & North Africa (excluding high income)Middle East & North Africa (IDA & IBRD countries)Middle incomeMoldovaMonacoMongoliaMontenegroMoroccoMozambiqueMyanmarNamibiaNauruNepalNetherlandsNew CaledoniaNew ZealandNicaraguaNigerNigeriaNorth AmericaNorthern Mariana IslandsNorwayOECD membersOmanOther small statesPacific island small statesPakistanPalauPanamaPapua New GuineaParaguayPeruPhilippinesPolandPortugalPost-demographic dividendPre-demographic dividendPuerto RicoQatarRomaniaRussian FederationRwandaSamoaSan MarinoSao Tome and PrincipeSaudi ArabiaSenegalSerbiaSeychellesSierra LeoneSingaporeSint Maarten (Dutch part)Slovak RepublicSloveniaSmall statesSolomon IslandsSomaliaSouth AfricaSouth AsiaSouth Asia (IDA & IBRD)South SudanSpainSri LankaSt. Kitts and NevisSt. LuciaSt. Vincent and the GrenadinesSub-Saharan Africa Sub-Saharan Africa (excluding high income)Sub-Saharan Africa (IDA & IBRD countries)SudanSurinameSwazilandSwedenSwitzerlandSyrian Arab RepublicTajikistanTanzaniaThailandTimor-LesteTogoTongaTrinidad and TobagoTunisiaTurkeyTurkmenistanTurks and Caicos IslandsTuvaluUgandaUkraineUnited Arab EmiratesUnited KingdomUnited StatesUpper middle incomeUruguayUzbekistanVanuatuVenezuela, RBVietnamVirgin Islands (U.S.)West Bank and GazaWorldYemen, Rep.ZambiaZimbabwe Zeitlinie:
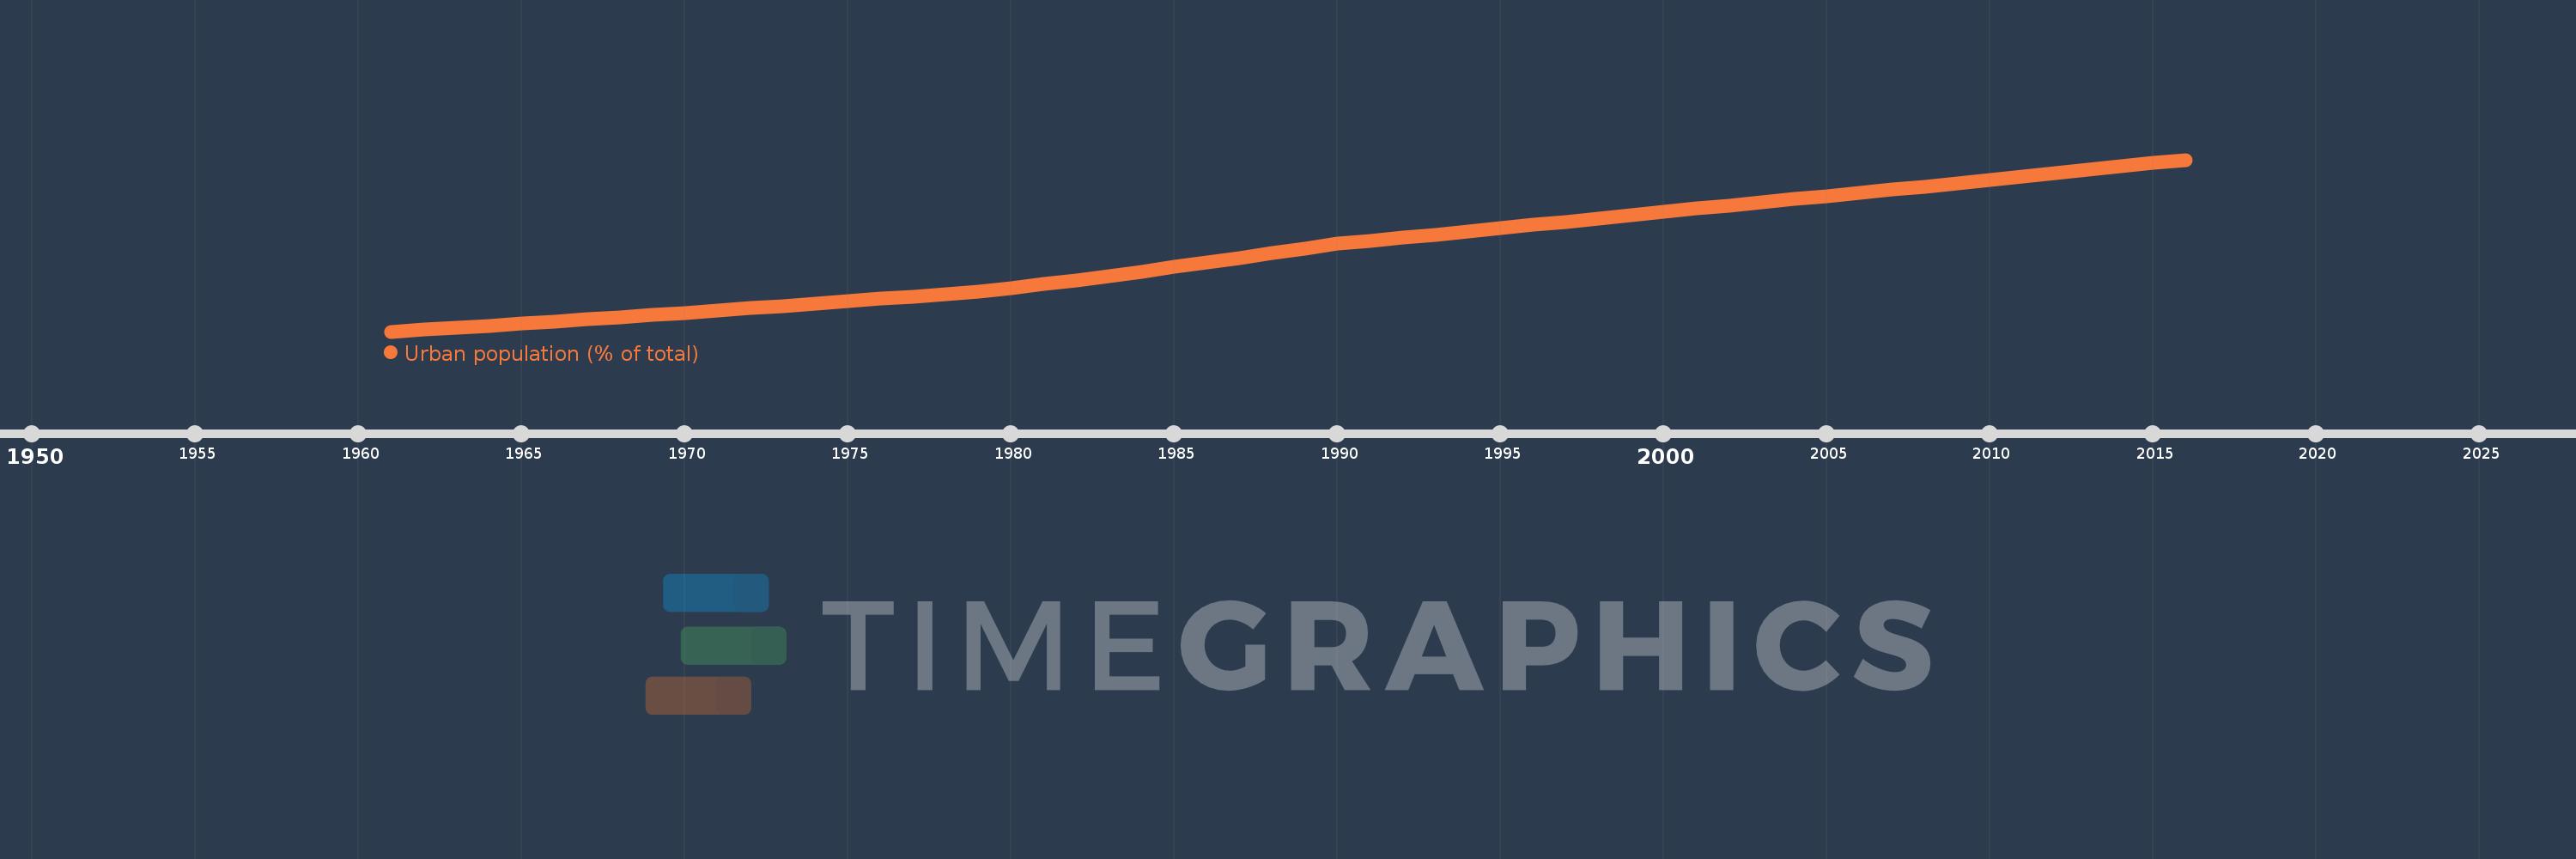
Diese Zeitleiste vorliegt die Graphik ab 1961 J. bis 2016 J. Vanuatu. Die Angaben bis 1960 J. sind nicht vorhanden. Die Zahl aktueller Beobachtungen nach Daten: 56.
Die Quelle (Bezeichnung):
Kennzahlen der Weltentwicklung
Die Quelle (Einrichtung):
United Nations, World Urbanization Prospects.
Kategorien:
Climate Change, Urban Development
Es wurde aktualisiert:
23 Apr 2017 Jahr
Kennzahlen der Wertänderungen vom Jahr zum Jahr
Minimum:
10.404
1 Jan 1961 Jahr
Maximum:
26.128
1 Jan 2016 Jahr
Zum Datum der Beobachtung
Wert
Absolute Veränderung
Die Veränderung bezüglich dem vorherigen Wert
1 Jan 1961 Jahr
10.404
+10.404
0.0%
1 Jan 1962 Jahr
10.583
+0.179
1.72%
1 Jan 1963 Jahr
10.765
+0.182
1.72%
1 Jan 1964 Jahr
10.95
+0.185
1.72%
1 Jan 1965 Jahr
11.138
+0.188
1.72%
1 Jan 1966 Jahr
11.329
+0.191
1.71%
1 Jan 1967 Jahr
11.522
+0.193
1.7%
1 Jan 1968 Jahr
11.718
+0.196
1.7%
1 Jan 1969 Jahr
11.918
+0.2
1.71%
1 Jan 1970 Jahr
12.12
+0.202
1.69%
1 Jan 1971 Jahr
12.325
+0.205
1.69%
1 Jan 1972 Jahr
12.533
+0.208
1.69%
1 Jan 1973 Jahr
12.744
+0.211
1.68%
1 Jan 1974 Jahr
12.958
+0.214
1.68%
1 Jan 1975 Jahr
13.175
+0.217
1.67%
1 Jan 1976 Jahr
13.395
+0.22
1.67%
1 Jan 1977 Jahr
13.619
+0.224
1.67%
1 Jan 1978 Jahr
13.845
+0.226
1.66%
1 Jan 1979 Jahr
14.074
+0.229
1.65%
1 Jan 1980 Jahr
14.368
+0.294
2.09%
1 Jan 1981 Jahr
14.74
+0.372
2.59%
1 Jan 1982 Jahr
15.12
+0.38
2.58%
1 Jan 1983 Jahr
15.508
+0.388
2.57%
1 Jan 1984 Jahr
15.905
+0.397
2.56%
1 Jan 1985 Jahr
16.31
+0.405
2.55%
1 Jan 1986 Jahr
16.722
+0.412
2.53%
1 Jan 1987 Jahr
17.143
+0.421
2.52%
1 Jan 1988 Jahr
17.573
+0.43
2.51%
1 Jan 1989 Jahr
18.011
+0.438
2.49%
1 Jan 1990 Jahr
18.435
+0.424
2.35%
1 Jan 1991 Jahr
18.715
+0.28
1.52%
1 Jan 1992 Jahr
18.998
+0.283
1.51%
1 Jan 1993 Jahr
19.285
+0.287
1.51%
1 Jan 1994 Jahr
19.574
+0.289
1.5%
1 Jan 1995 Jahr
19.868
+0.294
1.5%
1 Jan 1996 Jahr
20.164
+0.296
1.49%
1 Jan 1997 Jahr
20.464
+0.3
1.49%
1 Jan 1998 Jahr
20.766
+0.302
1.48%
1 Jan 1999 Jahr
21.073
+0.307
1.48%
1 Jan 2000 Jahr
21.382
+0.309
1.47%
1 Jan 2001 Jahr
21.673
+0.291
1.36%
1 Jan 2002 Jahr
21.953
+0.28
1.29%
1 Jan 2003 Jahr
22.235
+0.282
1.28%
1 Jan 2004 Jahr
22.521
+0.286
1.29%
1 Jan 2005 Jahr
22.809
+0.288
1.28%
1 Jan 2006 Jahr
23.099
+0.29
1.27%
1 Jan 2007 Jahr
23.392
+0.293
1.27%
1 Jan 2008 Jahr
23.687
+0.295
1.26%
1 Jan 2009 Jahr
23.985
+0.298
1.26%
1 Jan 2010 Jahr
24.286
+0.301
1.25%
1 Jan 2011 Jahr
24.589
+0.303
1.25%
1 Jan 2012 Jahr
24.894
+0.305
1.24%
1 Jan 2013 Jahr
25.2
+0.306
1.23%
1 Jan 2014 Jahr
25.508
+0.308
1.22%
1 Jan 2015 Jahr
25.817
+0.309
1.21%
1 Jan 2016 Jahr
26.128
+0.311
1.2%
Bewertung der Länder gemäß mit laufender Statistik nach Jahren


Kommentare: