29
/de/
de
AIzaSyAYiBZKx7MnpbEhh9jyipgxe19OcubqV5w
April 1, 2024
211685
Niger
NER
true
2
1
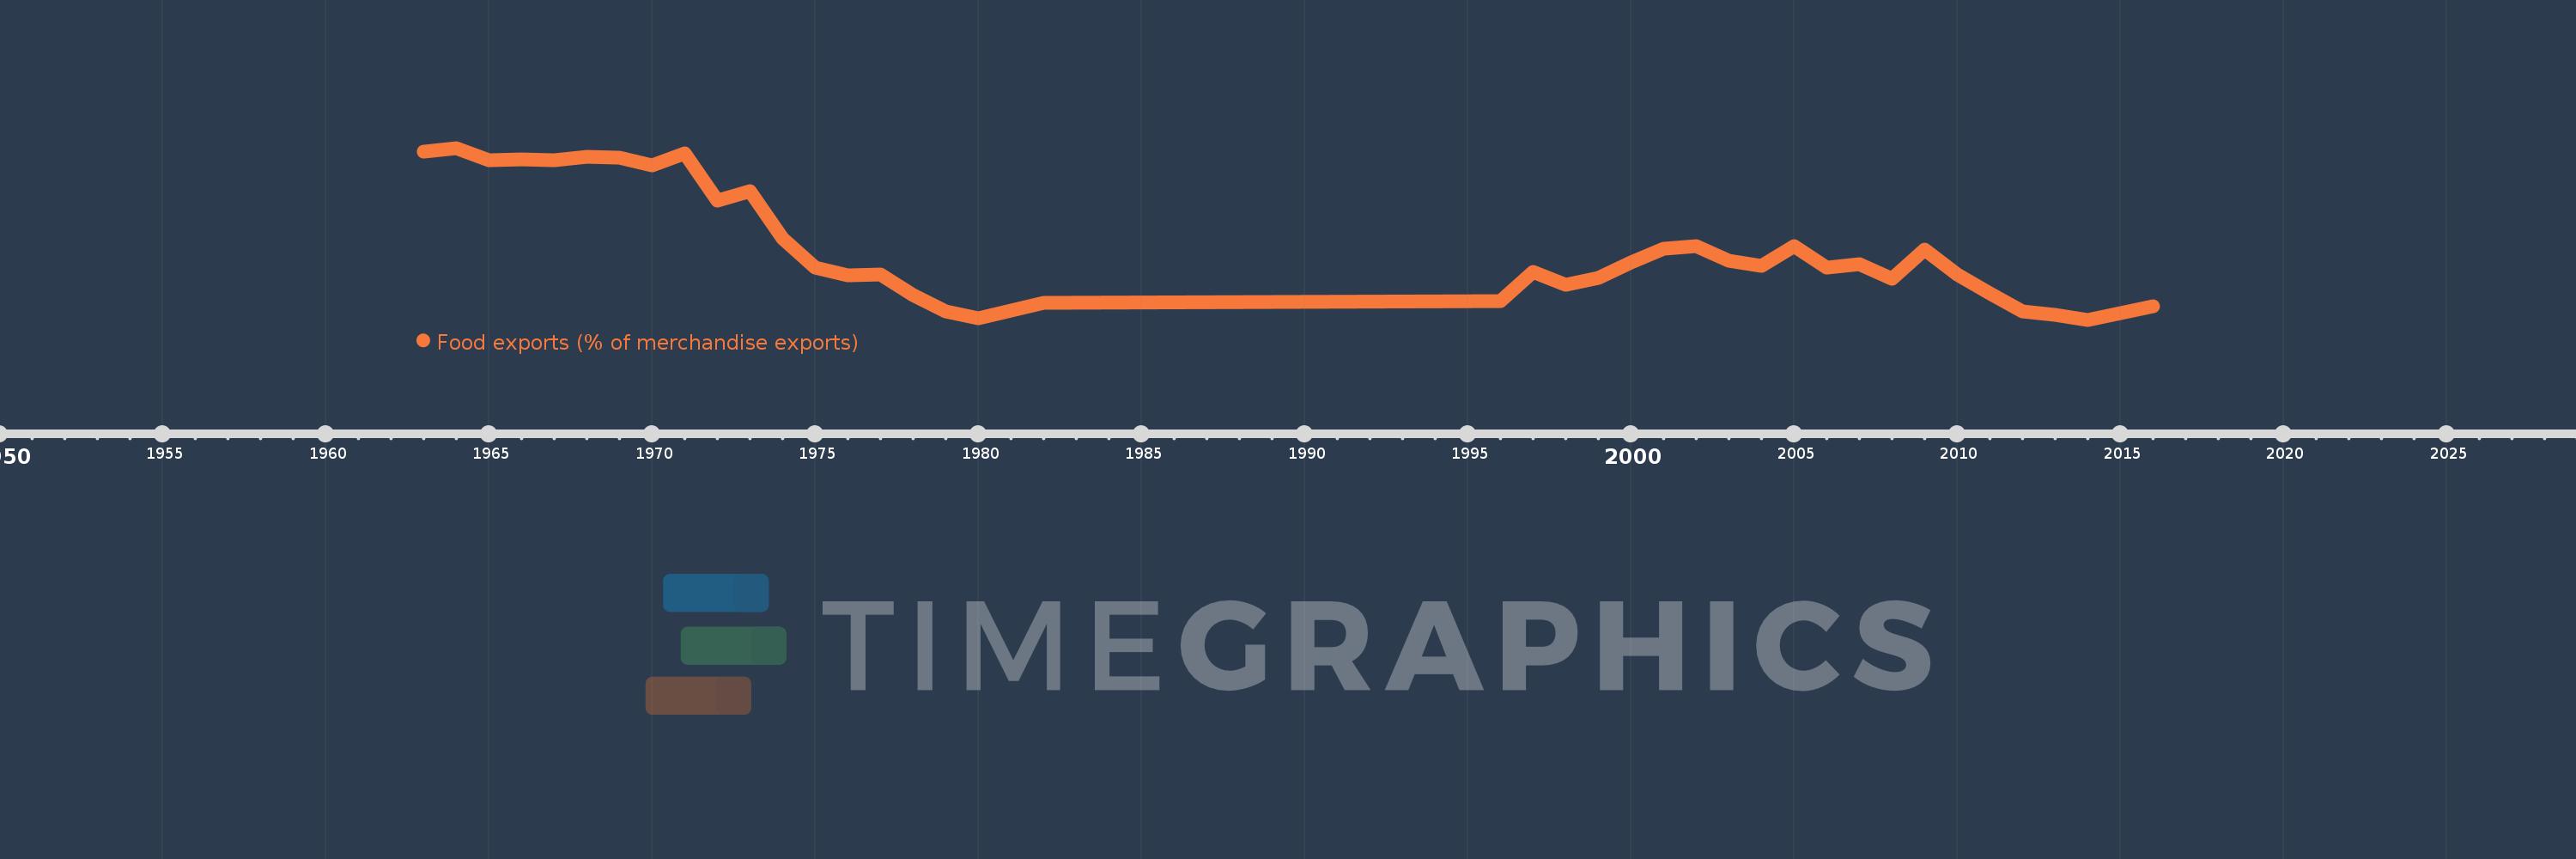
Food exports (% of merchandise exports)
2016,2015,2014,2013,2012,2011,2010,2009,2008,2007,2006,2005,2004,2003,2002,2001,2000,1999,1998,1997,1996,1982,1980,1979,1978,1977,1976,1975,1974,1973,1972,1971,1970,1969,1968,1967,1966,1965,1964,1963
Diese Statistik in anderen Ländern:
AfghanistanAlbaniaAlgeriaAndorraAngolaAntigua and BarbudaArab WorldArgentinaArmeniaArubaAustraliaAustriaAzerbaijanBahamas, TheBahrainBangladeshBarbadosBelarusBelgiumBelizeBeninBermudaBhutanBoliviaBosnia and HerzegovinaBotswanaBrazilBrunei DarussalamBulgariaBurkina FasoBurundiCabo VerdeCambodiaCameroonCanadaCaribbean small statesCayman IslandsCentral African RepublicCentral Europe and the BalticsChadChileChinaColombiaComorosCongo, Dem. Rep.Congo, Rep.Costa RicaCote d'IvoireCroatiaCubaCyprusCzech RepublicDenmarkDjiboutiDominicaDominican RepublicEarly-demographic dividendEast Asia & PacificEast Asia & Pacific (excluding high income)East Asia & Pacific (IDA & IBRD countries)EcuadorEgypt, Arab Rep.El SalvadorEquatorial GuineaEritreaEstoniaEthiopiaEuro areaEurope & Central AsiaEurope & Central Asia (excluding high income)Europe & Central Asia (IDA & IBRD countries)European UnionFaroe IslandsFijiFinlandFragile and conflict affected situationsFranceFrench PolynesiaGabonGambia, TheGeorgiaGermanyGhanaGreeceGreenlandGrenadaGuatemalaGuineaGuinea-BissauGuyanaHaitiHeavily indebted poor countries (HIPC)High incomeHondurasHong Kong SAR, ChinaHungaryIBRD onlyIcelandIDA & IBRD totalIDA blendIDA onlyIDA totalIndiaIndonesiaIran, Islamic Rep.IraqIrelandIsraelItalyJamaicaJapanJordanKazakhstanKenyaKiribatiKorea, Rep.KuwaitKyrgyz RepublicLao PDRLate-demographic dividendLatin America & Caribbean Latin America & Caribbean (excluding high income)Latin America & the Caribbean (IDA & IBRD countries)LatviaLeast developed countries: UN classificationLebanonLesothoLiberiaLibyaLithuaniaLow & middle incomeLower middle incomeLuxembourgMacao SAR, ChinaMacedonia, FYRMadagascarMalawiMalaysiaMaldivesMaliMaltaMauritaniaMauritiusMexicoMiddle East & North AfricaMiddle East & North Africa (excluding high income)Middle East & North Africa (IDA & IBRD countries)Middle incomeMoldovaMongoliaMoroccoMozambiqueMyanmarNamibiaNepalNetherlandsNew CaledoniaNew ZealandNicaraguaNigerNigeriaNorth AmericaNorwayOECD membersOmanOther small statesPacific island small statesPakistanPalauPanamaPapua New GuineaParaguayPeruPhilippinesPolandPortugalPost-demographic dividendPre-demographic dividendQatarRomaniaRussian FederationRwandaSamoaSao Tome and PrincipeSaudi ArabiaSenegalSerbiaSeychellesSierra LeoneSingaporeSlovak RepublicSloveniaSmall statesSolomon IslandsSomaliaSouth AfricaSouth AsiaSouth Asia (IDA & IBRD)SpainSri LankaSt. Kitts and NevisSt. LuciaSt. Vincent and the GrenadinesSub-Saharan Africa Sub-Saharan Africa (excluding high income)Sub-Saharan Africa (IDA & IBRD countries)SudanSurinameSwazilandSwedenSwitzerlandSyrian Arab RepublicTajikistanTanzaniaThailandTimor-LesteTogoTongaTrinidad and TobagoTunisiaTurkeyTurkmenistanTurks and Caicos IslandsTuvaluUgandaUkraineUnited Arab EmiratesUnited KingdomUnited StatesUpper middle incomeUruguayVanuatuVenezuela, RBVietnamVirgin Islands (U.S.)WorldYemen, Rep.ZambiaZimbabwe Zeitlinie:
Diese Zeitleiste vorliegt die Graphik ab 1963 J. bis 2016 J. Niger. Die Angaben bis 1962 J. sind nicht vorhanden. Die Zahl aktueller Beobachtungen nach Daten: 40.
Die Quelle (Bezeichnung):
Kennzahlen der Weltentwicklung
Die Quelle (Einrichtung):
World Bank staff estimates from the Comtrade database maintained by the United Nations Statistics Division.
Kategorien:
Private Sector, Trade
Es wurde aktualisiert:
23 Apr 2017 Jahr
Kennzahlen der Wertänderungen vom Jahr zum Jahr
Minimum:
8.034
1 Jan 2014 Jahr
Maximum:
93.961
1 Jan 1964 Jahr
Zum Datum der Beobachtung
Wert
Absolute Veränderung
Die Veränderung bezüglich dem vorherigen Wert
1 Jan 1963 Jahr
92.005
+92.005
0.0%
1 Jan 1964 Jahr
93.961
+1.955
2.13%
1 Jan 1965 Jahr
87.722
-6.238
-6.64%
1 Jan 1966 Jahr
88.237
+0.515
0.59%
1 Jan 1967 Jahr
87.874
-0.363
-0.41%
1 Jan 1968 Jahr
89.542
+1.668
1.9%
1 Jan 1969 Jahr
89.215
-0.327
-0.36%
1 Jan 1970 Jahr
85.314
-3.901
-4.37%
1 Jan 1971 Jahr
91.261
+5.946
6.97%
1 Jan 1972 Jahr
67.494
-23.767
-26.04%
1 Jan 1973 Jahr
72.167
+4.673
6.92%
1 Jan 1974 Jahr
48.725
-23.442
-32.48%
1 Jan 1975 Jahr
34.008
-14.717
-30.2%
1 Jan 1976 Jahr
30.156
-3.852
-11.33%
1 Jan 1977 Jahr
30.688
+0.531
1.76%
1 Jan 1978 Jahr
20.279
-10.408
-33.92%
1 Jan 1979 Jahr
12.262
-8.018
-39.54%
1 Jan 1980 Jahr
8.625
-3.636
-29.66%
1 Jan 1982 Jahr
16.338
+7.713
89.42%
1 Jan 1996 Jahr
17.441
+1.102
6.75%
1 Jan 1997 Jahr
31.896
+14.455
82.88%
1 Jan 1998 Jahr
25.357
-6.539
-20.5%
1 Jan 1999 Jahr
28.756
+3.399
13.4%
1 Jan 2000 Jahr
36.481
+7.725
26.86%
1 Jan 2001 Jahr
43.531
+7.049
19.32%
1 Jan 2002 Jahr
44.992
+1.461
3.36%
1 Jan 2003 Jahr
37.434
-7.557
-16.8%
1 Jan 2004 Jahr
35.163
-2.271
-6.07%
1 Jan 2005 Jahr
44.868
+9.705
27.6%
1 Jan 2006 Jahr
34.276
-10.592
-23.61%
1 Jan 2007 Jahr
35.97
+1.694
4.94%
1 Jan 2008 Jahr
28.58
-7.39
-20.55%
1 Jan 2009 Jahr
43.017
+14.438
50.52%
1 Jan 2010 Jahr
30.813
-12.205
-28.37%
1 Jan 2011 Jahr
21.137
-9.675
-31.4%
1 Jan 2012 Jahr
12.309
-8.828
-41.76%
1 Jan 2013 Jahr
10.47
-1.839
-14.94%
1 Jan 2014 Jahr
8.034
-2.436
-23.27%
1 Jan 2015 Jahr
11.384
+3.349
41.69%
1 Jan 2016 Jahr
14.809
+3.425
30.09%
Bewertung der Länder gemäß mit laufender Statistik nach Jahren


Kommentare: