29
/de/
de
AIzaSyAYiBZKx7MnpbEhh9jyipgxe19OcubqV5w
April 1, 2024
104848
Chile
CHL
true
2
1
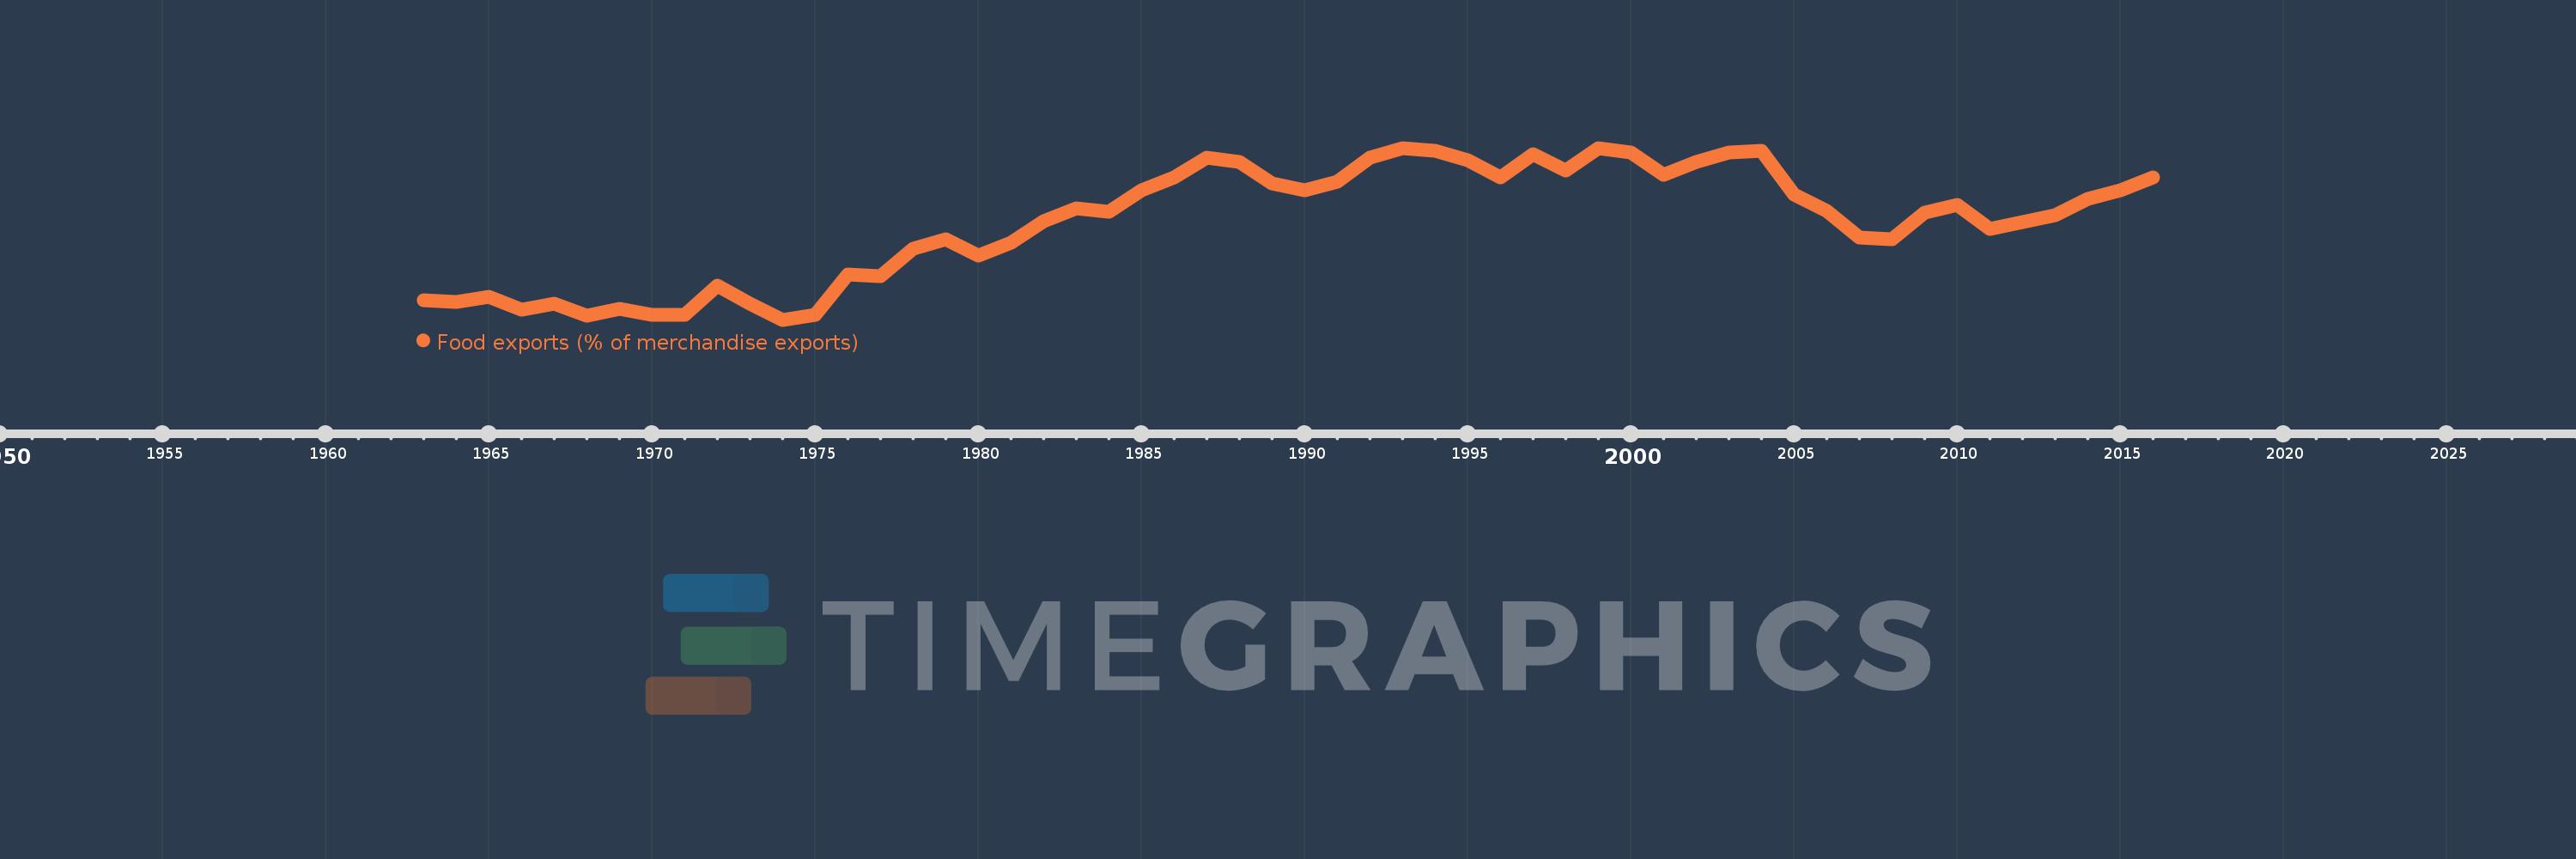
Food exports (% of merchandise exports)
2016,2015,2014,2013,2012,2011,2010,2009,2008,2007,2006,2005,2004,2003,2002,2001,2000,1999,1998,1997,1996,1995,1994,1993,1992,1991,1990,1989,1988,1987,1986,1985,1984,1983,1982,1981,1980,1979,1978,1977,1976,1975,1974,1973,1972,1971,1970,1969,1968,1967,1966,1965,1964,1963
Diese Statistik in anderen Ländern:
AfghanistanAlbaniaAlgeriaAndorraAngolaAntigua and BarbudaArab WorldArgentinaArmeniaArubaAustraliaAustriaAzerbaijanBahamas, TheBahrainBangladeshBarbadosBelarusBelgiumBelizeBeninBermudaBhutanBoliviaBosnia and HerzegovinaBotswanaBrazilBrunei DarussalamBulgariaBurkina FasoBurundiCabo VerdeCambodiaCameroonCanadaCaribbean small statesCayman IslandsCentral African RepublicCentral Europe and the BalticsChadChileChinaColombiaComorosCongo, Dem. Rep.Congo, Rep.Costa RicaCote d'IvoireCroatiaCubaCyprusCzech RepublicDenmarkDjiboutiDominicaDominican RepublicEarly-demographic dividendEast Asia & PacificEast Asia & Pacific (excluding high income)East Asia & Pacific (IDA & IBRD countries)EcuadorEgypt, Arab Rep.El SalvadorEquatorial GuineaEritreaEstoniaEthiopiaEuro areaEurope & Central AsiaEurope & Central Asia (excluding high income)Europe & Central Asia (IDA & IBRD countries)European UnionFaroe IslandsFijiFinlandFragile and conflict affected situationsFranceFrench PolynesiaGabonGambia, TheGeorgiaGermanyGhanaGreeceGreenlandGrenadaGuatemalaGuineaGuinea-BissauGuyanaHaitiHeavily indebted poor countries (HIPC)High incomeHondurasHong Kong SAR, ChinaHungaryIBRD onlyIcelandIDA & IBRD totalIDA blendIDA onlyIDA totalIndiaIndonesiaIran, Islamic Rep.IraqIrelandIsraelItalyJamaicaJapanJordanKazakhstanKenyaKiribatiKorea, Rep.KuwaitKyrgyz RepublicLao PDRLate-demographic dividendLatin America & Caribbean Latin America & Caribbean (excluding high income)Latin America & the Caribbean (IDA & IBRD countries)LatviaLeast developed countries: UN classificationLebanonLesothoLiberiaLibyaLithuaniaLow & middle incomeLower middle incomeLuxembourgMacao SAR, ChinaMacedonia, FYRMadagascarMalawiMalaysiaMaldivesMaliMaltaMauritaniaMauritiusMexicoMiddle East & North AfricaMiddle East & North Africa (excluding high income)Middle East & North Africa (IDA & IBRD countries)Middle incomeMoldovaMongoliaMoroccoMozambiqueMyanmarNamibiaNepalNetherlandsNew CaledoniaNew ZealandNicaraguaNigerNigeriaNorth AmericaNorwayOECD membersOmanOther small statesPacific island small statesPakistanPalauPanamaPapua New GuineaParaguayPeruPhilippinesPolandPortugalPost-demographic dividendPre-demographic dividendQatarRomaniaRussian FederationRwandaSamoaSao Tome and PrincipeSaudi ArabiaSenegalSerbiaSeychellesSierra LeoneSingaporeSlovak RepublicSloveniaSmall statesSolomon IslandsSomaliaSouth AfricaSouth AsiaSouth Asia (IDA & IBRD)SpainSri LankaSt. Kitts and NevisSt. LuciaSt. Vincent and the GrenadinesSub-Saharan Africa Sub-Saharan Africa (excluding high income)Sub-Saharan Africa (IDA & IBRD countries)SudanSurinameSwazilandSwedenSwitzerlandSyrian Arab RepublicTajikistanTanzaniaThailandTimor-LesteTogoTongaTrinidad and TobagoTunisiaTurkeyTurkmenistanTurks and Caicos IslandsTuvaluUgandaUkraineUnited Arab EmiratesUnited KingdomUnited StatesUpper middle incomeUruguayVanuatuVenezuela, RBVietnamVirgin Islands (U.S.)WorldYemen, Rep.ZambiaZimbabwe Zeitlinie:
Diese Zeitleiste vorliegt die Graphik ab 1963 J. bis 2016 J. Chile. Die Angaben bis 1962 J. sind nicht vorhanden. Die Zahl aktueller Beobachtungen nach Daten: 54.
Die Quelle (Bezeichnung):
Kennzahlen der Weltentwicklung
Die Quelle (Einrichtung):
World Bank staff estimates from the Comtrade database maintained by the United Nations Statistics Division.
Kategorien:
Private Sector, Trade
Es wurde aktualisiert:
23 Apr 2017 Jahr
Kennzahlen der Wertänderungen vom Jahr zum Jahr
Minimum:
3.792
1 Jan 1974 Jahr
Maximum:
28.51
1 Jan 1999 Jahr
Zum Datum der Beobachtung
Wert
Absolute Veränderung
Die Veränderung bezüglich dem vorherigen Wert
1 Jan 1963 Jahr
6.621
+6.621
0.0%
1 Jan 1964 Jahr
6.299
-0.323
-4.87%
1 Jan 1965 Jahr
7.07
+0.771
12.24%
1 Jan 1966 Jahr
5.217
-1.852
-26.2%
1 Jan 1967 Jahr
6.056
+0.839
16.07%
1 Jan 1968 Jahr
4.374
-1.682
-27.77%
1 Jan 1969 Jahr
5.325
+0.95
21.72%
1 Jan 1970 Jahr
4.496
-0.829
-15.57%
1 Jan 1971 Jahr
4.544
+0.048
1.06%
1 Jan 1972 Jahr
8.655
+4.111
90.49%
1 Jan 1973 Jahr
6.162
-2.493
-28.8%
1 Jan 1974 Jahr
3.792
-2.37
-38.46%
1 Jan 1975 Jahr
4.495
+0.703
18.53%
1 Jan 1976 Jahr
10.319
+5.824
129.57%
1 Jan 1977 Jahr
10.014
-0.305
-2.95%
1 Jan 1978 Jahr
14.018
+4.004
39.98%
1 Jan 1979 Jahr
15.41
+1.393
9.93%
1 Jan 1980 Jahr
13.042
-2.368
-15.37%
1 Jan 1981 Jahr
14.912
+1.87
14.34%
1 Jan 1982 Jahr
17.929
+3.017
20.23%
1 Jan 1983 Jahr
19.761
+1.832
10.22%
1 Jan 1984 Jahr
19.338
-0.423
-2.14%
1 Jan 1985 Jahr
22.38
+3.043
15.73%
1 Jan 1986 Jahr
24.22
+1.84
8.22%
1 Jan 1987 Jahr
27.122
+2.901
11.98%
1 Jan 1988 Jahr
26.556
-0.566
-2.09%
1 Jan 1989 Jahr
23.42
-3.135
-11.81%
1 Jan 1990 Jahr
22.473
-0.947
-4.04%
1 Jan 1991 Jahr
23.69
+1.216
5.41%
1 Jan 1992 Jahr
27.104
+3.415
14.41%
1 Jan 1993 Jahr
28.465
+1.361
5.02%
1 Jan 1994 Jahr
28.043
-0.422
-1.48%
1 Jan 1995 Jahr
26.735
-1.308
-4.66%
1 Jan 1996 Jahr
24.216
-2.519
-9.42%
1 Jan 1997 Jahr
27.555
+3.339
13.79%
1 Jan 1998 Jahr
25.288
-2.268
-8.23%
1 Jan 1999 Jahr
28.51
+3.222
12.74%
1 Jan 2000 Jahr
27.898
-0.611
-2.14%
1 Jan 2001 Jahr
24.677
-3.221
-11.55%
1 Jan 2002 Jahr
26.454
+1.777
7.2%
1 Jan 2003 Jahr
27.88
+1.426
5.39%
1 Jan 2004 Jahr
28.145
+0.265
0.95%
1 Jan 2005 Jahr
21.766
-6.378
-22.66%
1 Jan 2006 Jahr
19.421
-2.346
-10.78%
1 Jan 2007 Jahr
15.615
-3.805
-19.6%
1 Jan 2008 Jahr
15.34
-0.276
-1.76%
1 Jan 2009 Jahr
19.145
+3.806
24.81%
1 Jan 2010 Jahr
20.303
+1.158
6.05%
1 Jan 2011 Jahr
16.858
-3.444
-16.96%
1 Jan 2012 Jahr
17.802
+0.943
5.6%
1 Jan 2013 Jahr
18.886
+1.084
6.09%
1 Jan 2014 Jahr
21.138
+2.253
11.93%
1 Jan 2015 Jahr
22.452
+1.314
6.21%
1 Jan 2016 Jahr
24.224
+1.773
7.89%
Bewertung der Länder gemäß mit laufender Statistik nach Jahren


Kommentare: