29
/de/
de
AIzaSyAYiBZKx7MnpbEhh9jyipgxe19OcubqV5w
April 1, 2024
151554
Hong Kong SAR, China
HKG
true
2
1
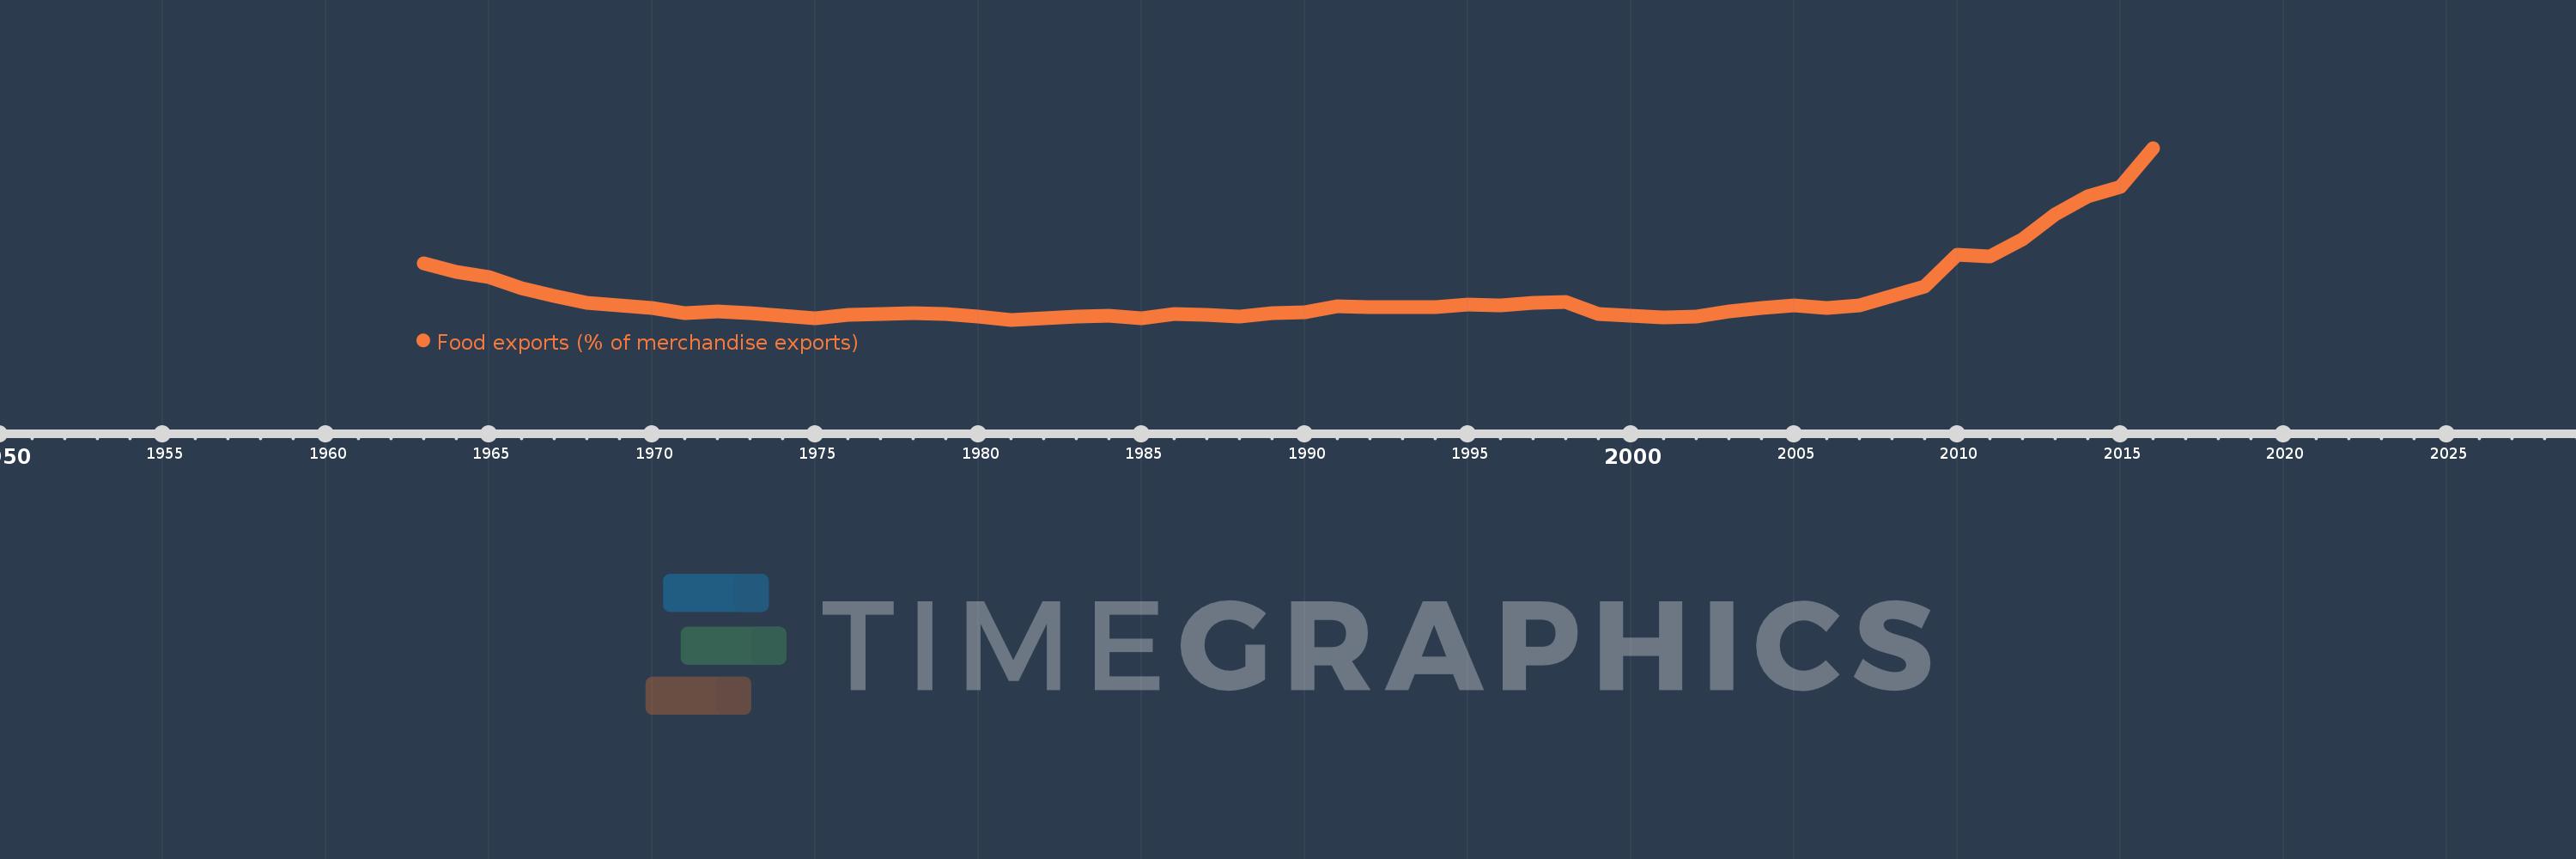
Food exports (% of merchandise exports)
2016,2015,2014,2013,2012,2011,2010,2009,2008,2007,2006,2005,2004,2003,2002,2001,2000,1999,1998,1997,1996,1995,1994,1993,1992,1991,1990,1989,1988,1987,1986,1985,1984,1983,1982,1981,1980,1979,1978,1977,1976,1975,1974,1973,1972,1971,1970,1969,1968,1967,1966,1965,1964,1963
Diese Statistik in anderen Ländern:
AfghanistanAlbaniaAlgeriaAndorraAngolaAntigua and BarbudaArab WorldArgentinaArmeniaArubaAustraliaAustriaAzerbaijanBahamas, TheBahrainBangladeshBarbadosBelarusBelgiumBelizeBeninBermudaBhutanBoliviaBosnia and HerzegovinaBotswanaBrazilBrunei DarussalamBulgariaBurkina FasoBurundiCabo VerdeCambodiaCameroonCanadaCaribbean small statesCayman IslandsCentral African RepublicCentral Europe and the BalticsChadChileChinaColombiaComorosCongo, Dem. Rep.Congo, Rep.Costa RicaCote d'IvoireCroatiaCubaCyprusCzech RepublicDenmarkDjiboutiDominicaDominican RepublicEarly-demographic dividendEast Asia & PacificEast Asia & Pacific (excluding high income)East Asia & Pacific (IDA & IBRD countries)EcuadorEgypt, Arab Rep.El SalvadorEquatorial GuineaEritreaEstoniaEthiopiaEuro areaEurope & Central AsiaEurope & Central Asia (excluding high income)Europe & Central Asia (IDA & IBRD countries)European UnionFaroe IslandsFijiFinlandFragile and conflict affected situationsFranceFrench PolynesiaGabonGambia, TheGeorgiaGermanyGhanaGreeceGreenlandGrenadaGuatemalaGuineaGuinea-BissauGuyanaHaitiHeavily indebted poor countries (HIPC)High incomeHondurasHong Kong SAR, ChinaHungaryIBRD onlyIcelandIDA & IBRD totalIDA blendIDA onlyIDA totalIndiaIndonesiaIran, Islamic Rep.IraqIrelandIsraelItalyJamaicaJapanJordanKazakhstanKenyaKiribatiKorea, Rep.KuwaitKyrgyz RepublicLao PDRLate-demographic dividendLatin America & Caribbean Latin America & Caribbean (excluding high income)Latin America & the Caribbean (IDA & IBRD countries)LatviaLeast developed countries: UN classificationLebanonLesothoLiberiaLibyaLithuaniaLow & middle incomeLower middle incomeLuxembourgMacao SAR, ChinaMacedonia, FYRMadagascarMalawiMalaysiaMaldivesMaliMaltaMauritaniaMauritiusMexicoMiddle East & North AfricaMiddle East & North Africa (excluding high income)Middle East & North Africa (IDA & IBRD countries)Middle incomeMoldovaMongoliaMoroccoMozambiqueMyanmarNamibiaNepalNetherlandsNew CaledoniaNew ZealandNicaraguaNigerNigeriaNorth AmericaNorwayOECD membersOmanOther small statesPacific island small statesPakistanPalauPanamaPapua New GuineaParaguayPeruPhilippinesPolandPortugalPost-demographic dividendPre-demographic dividendQatarRomaniaRussian FederationRwandaSamoaSao Tome and PrincipeSaudi ArabiaSenegalSerbiaSeychellesSierra LeoneSingaporeSlovak RepublicSloveniaSmall statesSolomon IslandsSomaliaSouth AfricaSouth AsiaSouth Asia (IDA & IBRD)SpainSri LankaSt. Kitts and NevisSt. LuciaSt. Vincent and the GrenadinesSub-Saharan Africa Sub-Saharan Africa (excluding high income)Sub-Saharan Africa (IDA & IBRD countries)SudanSurinameSwazilandSwedenSwitzerlandSyrian Arab RepublicTajikistanTanzaniaThailandTimor-LesteTogoTongaTrinidad and TobagoTunisiaTurkeyTurkmenistanTurks and Caicos IslandsTuvaluUgandaUkraineUnited Arab EmiratesUnited KingdomUnited StatesUpper middle incomeUruguayVanuatuVenezuela, RBVietnamVirgin Islands (U.S.)WorldYemen, Rep.ZambiaZimbabwe Zeitlinie:
Diese Zeitleiste vorliegt die Graphik ab 1963 J. bis 2016 J. Hong Kong SAR, China. Die Angaben bis 1962 J. sind nicht vorhanden. Die Zahl aktueller Beobachtungen nach Daten: 54.
Die Quelle (Bezeichnung):
Kennzahlen der Weltentwicklung
Die Quelle (Einrichtung):
World Bank staff estimates from the Comtrade database maintained by the United Nations Statistics Division.
Kategorien:
Private Sector, Trade
Es wurde aktualisiert:
23 Apr 2017 Jahr
Kennzahlen der Wertänderungen vom Jahr zum Jahr
Minimum:
1.375
1 Jan 1981 Jahr
Maximum:
16.033
1 Jan 2016 Jahr
Zum Datum der Beobachtung
Wert
Absolute Veränderung
Die Veränderung bezüglich dem vorherigen Wert
1 Jan 1963 Jahr
6.219
+6.219
0.0%
1 Jan 1964 Jahr
5.44
-0.779
-12.52%
1 Jan 1965 Jahr
5.034
-0.407
-7.47%
1 Jan 1966 Jahr
4.093
-0.941
-18.69%
1 Jan 1967 Jahr
3.426
-0.667
-16.3%
1 Jan 1968 Jahr
2.851
-0.575
-16.78%
1 Jan 1969 Jahr
2.592
-0.259
-9.07%
1 Jan 1970 Jahr
2.367
-0.225
-8.68%
1 Jan 1971 Jahr
1.973
-0.394
-16.64%
1 Jan 1972 Jahr
2.094
+0.12
6.1%
1 Jan 1973 Jahr
1.925
-0.169
-8.06%
1 Jan 1974 Jahr
1.737
-0.188
-9.78%
1 Jan 1975 Jahr
1.53
-0.207
-11.89%
1 Jan 1976 Jahr
1.783
+0.253
16.53%
1 Jan 1977 Jahr
1.833
+0.05
2.79%
1 Jan 1978 Jahr
1.957
+0.124
6.75%
1 Jan 1979 Jahr
1.89
-0.066
-3.38%
1 Jan 1980 Jahr
1.649
-0.241
-12.76%
1 Jan 1981 Jahr
1.375
-0.275
-16.65%
1 Jan 1982 Jahr
1.513
+0.138
10.05%
1 Jan 1983 Jahr
1.624
+0.112
7.37%
1 Jan 1984 Jahr
1.699
+0.075
4.63%
1 Jan 1985 Jahr
1.478
-0.222
-13.04%
1 Jan 1986 Jahr
1.902
+0.424
28.72%
1 Jan 1987 Jahr
1.803
-0.099
-5.21%
1 Jan 1988 Jahr
1.679
-0.124
-6.87%
1 Jan 1989 Jahr
1.917
+0.238
14.16%
1 Jan 1990 Jahr
2.023
+0.106
5.52%
1 Jan 1991 Jahr
2.557
+0.534
26.38%
1 Jan 1992 Jahr
2.427
-0.129
-5.05%
1 Jan 1993 Jahr
2.464
+0.036
1.49%
1 Jan 1994 Jahr
2.47
+0.006
0.24%
1 Jan 1995 Jahr
2.693
+0.223
9.04%
1 Jan 1996 Jahr
2.616
-0.077
-2.87%
1 Jan 1997 Jahr
2.789
+0.173
6.62%
1 Jan 1998 Jahr
2.914
+0.126
4.5%
1 Jan 1999 Jahr
1.901
-1.013
-34.76%
1 Jan 2000 Jahr
1.686
-0.216
-11.34%
1 Jan 2001 Jahr
1.561
-0.125
-7.41%
1 Jan 2002 Jahr
1.68
+0.119
7.63%
1 Jan 2003 Jahr
2.099
+0.419
24.91%
1 Jan 2004 Jahr
2.348
+0.249
11.87%
1 Jan 2005 Jahr
2.596
+0.249
10.59%
1 Jan 2006 Jahr
2.412
-0.184
-7.11%
1 Jan 2007 Jahr
2.57
+0.158
6.56%
1 Jan 2008 Jahr
3.438
+0.868
33.78%
1 Jan 2009 Jahr
4.232
+0.793
23.08%
1 Jan 2010 Jahr
6.895
+2.663
62.93%
1 Jan 2011 Jahr
6.757
-0.137
-1.99%
1 Jan 2012 Jahr
8.259
+1.502
22.22%
1 Jan 2013 Jahr
10.37
+2.111
25.56%
1 Jan 2014 Jahr
11.942
+1.572
15.16%
1 Jan 2015 Jahr
12.72
+0.777
6.51%
1 Jan 2016 Jahr
16.033
+3.313
26.05%
Bewertung der Länder gemäß mit laufender Statistik nach Jahren


Kommentare: