29
/de/
de
AIzaSyAYiBZKx7MnpbEhh9jyipgxe19OcubqV5w
April 1, 2024
140361
Ghana
GHA
true
2
1
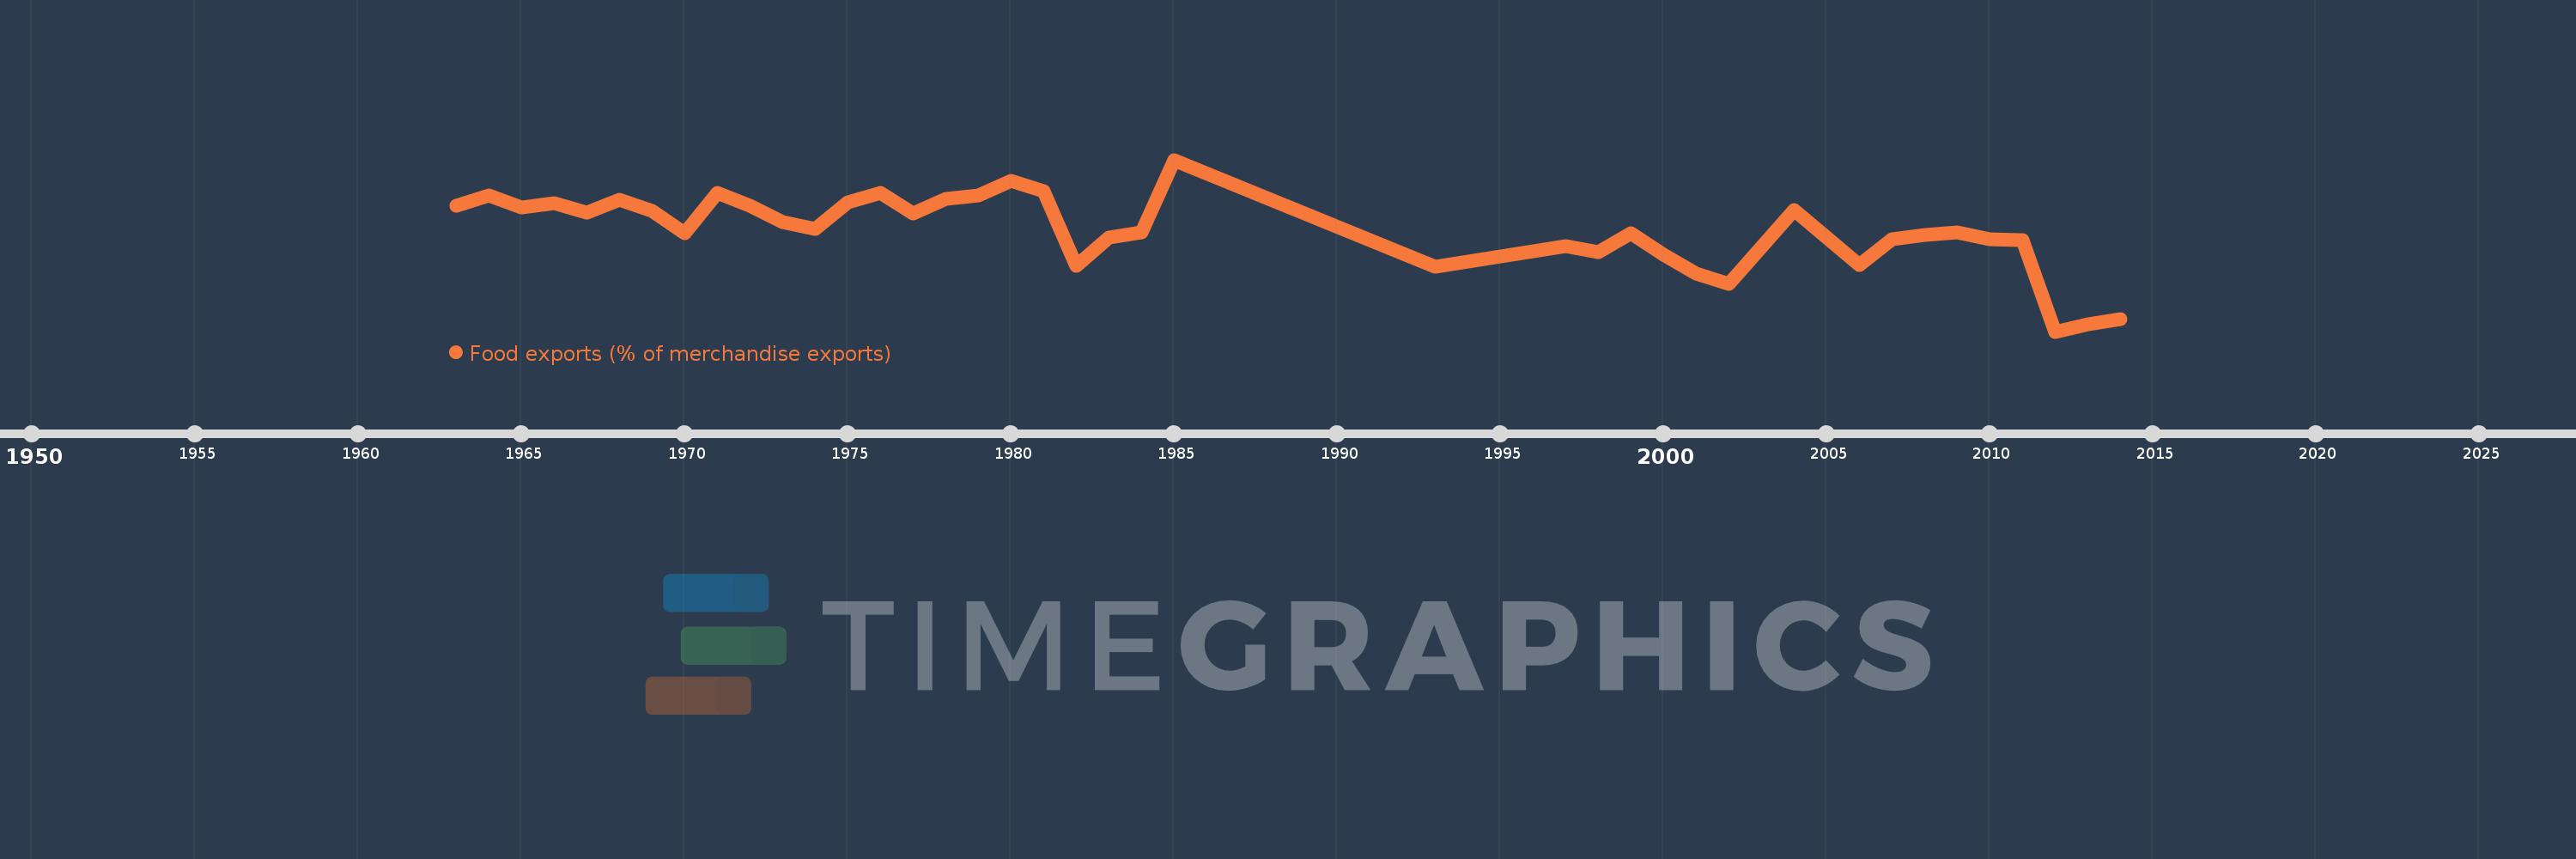
Food exports (% of merchandise exports)
2014,2013,2012,2011,2010,2009,2008,2007,2006,2004,2002,2001,2000,1999,1998,1997,1993,1985,1984,1983,1982,1981,1980,1979,1978,1977,1976,1975,1974,1973,1972,1971,1970,1969,1968,1967,1966,1965,1964,1963
Diese Statistik in anderen Ländern:
AfghanistanAlbaniaAlgeriaAndorraAngolaAntigua and BarbudaArab WorldArgentinaArmeniaArubaAustraliaAustriaAzerbaijanBahamas, TheBahrainBangladeshBarbadosBelarusBelgiumBelizeBeninBermudaBhutanBoliviaBosnia and HerzegovinaBotswanaBrazilBrunei DarussalamBulgariaBurkina FasoBurundiCabo VerdeCambodiaCameroonCanadaCaribbean small statesCayman IslandsCentral African RepublicCentral Europe and the BalticsChadChileChinaColombiaComorosCongo, Dem. Rep.Congo, Rep.Costa RicaCote d'IvoireCroatiaCubaCyprusCzech RepublicDenmarkDjiboutiDominicaDominican RepublicEarly-demographic dividendEast Asia & PacificEast Asia & Pacific (excluding high income)East Asia & Pacific (IDA & IBRD countries)EcuadorEgypt, Arab Rep.El SalvadorEquatorial GuineaEritreaEstoniaEthiopiaEuro areaEurope & Central AsiaEurope & Central Asia (excluding high income)Europe & Central Asia (IDA & IBRD countries)European UnionFaroe IslandsFijiFinlandFragile and conflict affected situationsFranceFrench PolynesiaGabonGambia, TheGeorgiaGermanyGhanaGreeceGreenlandGrenadaGuatemalaGuineaGuinea-BissauGuyanaHaitiHeavily indebted poor countries (HIPC)High incomeHondurasHong Kong SAR, ChinaHungaryIBRD onlyIcelandIDA & IBRD totalIDA blendIDA onlyIDA totalIndiaIndonesiaIran, Islamic Rep.IraqIrelandIsraelItalyJamaicaJapanJordanKazakhstanKenyaKiribatiKorea, Rep.KuwaitKyrgyz RepublicLao PDRLate-demographic dividendLatin America & Caribbean Latin America & Caribbean (excluding high income)Latin America & the Caribbean (IDA & IBRD countries)LatviaLeast developed countries: UN classificationLebanonLesothoLiberiaLibyaLithuaniaLow & middle incomeLower middle incomeLuxembourgMacao SAR, ChinaMacedonia, FYRMadagascarMalawiMalaysiaMaldivesMaliMaltaMauritaniaMauritiusMexicoMiddle East & North AfricaMiddle East & North Africa (excluding high income)Middle East & North Africa (IDA & IBRD countries)Middle incomeMoldovaMongoliaMoroccoMozambiqueMyanmarNamibiaNepalNetherlandsNew CaledoniaNew ZealandNicaraguaNigerNigeriaNorth AmericaNorwayOECD membersOmanOther small statesPacific island small statesPakistanPalauPanamaPapua New GuineaParaguayPeruPhilippinesPolandPortugalPost-demographic dividendPre-demographic dividendQatarRomaniaRussian FederationRwandaSamoaSao Tome and PrincipeSaudi ArabiaSenegalSerbiaSeychellesSierra LeoneSingaporeSlovak RepublicSloveniaSmall statesSolomon IslandsSomaliaSouth AfricaSouth AsiaSouth Asia (IDA & IBRD)SpainSri LankaSt. Kitts and NevisSt. LuciaSt. Vincent and the GrenadinesSub-Saharan Africa Sub-Saharan Africa (excluding high income)Sub-Saharan Africa (IDA & IBRD countries)SudanSurinameSwazilandSwedenSwitzerlandSyrian Arab RepublicTajikistanTanzaniaThailandTimor-LesteTogoTongaTrinidad and TobagoTunisiaTurkeyTurkmenistanTurks and Caicos IslandsTuvaluUgandaUkraineUnited Arab EmiratesUnited KingdomUnited StatesUpper middle incomeUruguayVanuatuVenezuela, RBVietnamVirgin Islands (U.S.)WorldYemen, Rep.ZambiaZimbabwe Zeitlinie:
Diese Zeitleiste vorliegt die Graphik ab 1963 J. bis 2014 J. Ghana. Die Angaben bis 1962 J. sind nicht vorhanden. Die Zahl aktueller Beobachtungen nach Daten: 40.
Die Quelle (Bezeichnung):
Kennzahlen der Weltentwicklung
Die Quelle (Einrichtung):
World Bank staff estimates from the Comtrade database maintained by the United Nations Statistics Division.
Kategorien:
Private Sector, Trade
Es wurde aktualisiert:
23 Apr 2017 Jahr
Kennzahlen der Wertänderungen vom Jahr zum Jahr
Minimum:
27.543
1 Jan 2012 Jahr
Maximum:
89.598
1 Jan 1985 Jahr
Zum Datum der Beobachtung
Wert
Absolute Veränderung
Die Veränderung bezüglich dem vorherigen Wert
1 Jan 1963 Jahr
72.915
+72.915
0.0%
1 Jan 1964 Jahr
76.728
+3.813
5.23%
1 Jan 1965 Jahr
72.476
-4.252
-5.54%
1 Jan 1966 Jahr
73.829
+1.353
1.87%
1 Jan 1967 Jahr
70.516
-3.313
-4.49%
1 Jan 1968 Jahr
75.069
+4.552
6.46%
1 Jan 1969 Jahr
71.271
-3.797
-5.06%
1 Jan 1970 Jahr
63.124
-8.148
-11.43%
1 Jan 1971 Jahr
77.747
+14.623
23.17%
1 Jan 1972 Jahr
73.137
-4.61
-5.93%
1 Jan 1973 Jahr
67.178
-5.959
-8.15%
1 Jan 1974 Jahr
64.615
-2.563
-3.82%
1 Jan 1975 Jahr
74.226
+9.611
14.87%
1 Jan 1976 Jahr
77.775
+3.549
4.78%
1 Jan 1977 Jahr
70.252
-7.522
-9.67%
1 Jan 1978 Jahr
75.532
+5.28
7.52%
1 Jan 1979 Jahr
76.665
+1.133
1.5%
1 Jan 1980 Jahr
81.924
+5.259
6.86%
1 Jan 1981 Jahr
78.423
-3.501
-4.27%
1 Jan 1982 Jahr
51.332
-27.091
-34.55%
1 Jan 1983 Jahr
61.618
+10.286
20.04%
1 Jan 1984 Jahr
63.239
+1.621
2.63%
1 Jan 1985 Jahr
89.598
+26.36
41.68%
1 Jan 1993 Jahr
50.942
-38.657
-43.14%
1 Jan 1997 Jahr
58.435
+7.494
14.71%
1 Jan 1998 Jahr
56.171
-2.265
-3.88%
1 Jan 1999 Jahr
63.143
+6.973
12.41%
1 Jan 2000 Jahr
55.402
-7.741
-12.26%
1 Jan 2001 Jahr
48.42
-6.982
-12.6%
1 Jan 2002 Jahr
44.887
-3.533
-7.3%
1 Jan 2004 Jahr
71.571
+26.685
59.45%
1 Jan 2006 Jahr
51.74
-19.831
-27.71%
1 Jan 2007 Jahr
61.037
+9.297
17.97%
1 Jan 2008 Jahr
62.534
+1.497
2.45%
1 Jan 2009 Jahr
63.461
+0.927
1.48%
1 Jan 2010 Jahr
61.036
-2.425
-3.82%
1 Jan 2011 Jahr
60.668
-0.368
-0.6%
1 Jan 2012 Jahr
27.543
-33.125
-54.6%
1 Jan 2013 Jahr
30.323
+2.78
10.09%
1 Jan 2014 Jahr
32.047
+1.725
5.69%
Bewertung der Länder gemäß mit laufender Statistik nach Jahren


Kommentare: