33
/
AIzaSyB4mHJ5NPEv-XzF7P6NDYXjlkCWaeKw5bc
November 30, 2025
99229
Cambodia
KHM
true
2
1
Rail lines (total route-km)
2006,2005,2003,2001,2000,1999,1998,1997,1996,1995,1994,1993,1992,1991
Create a timeline
Public Timelines
For education
For educational institutions
For teachers
For students
Cabinet
For educational institutions
For teachers
For students
Open cabinet
FAQ
Close
Create a timeline
Public timelines
FAQ
About & Feedback
Terms
Privacy
FAQ
Support 24/7
Cabinet
Get premium
Donate
Download
Global statistics library
→
Cambodia
→
Rail lines (total route-km)
This statistics in other country:
Albania
Algeria
Arab World
Argentina
Armenia
Australia
Austria
Azerbaijan
Bangladesh
Belarus
Belgium
Benin
Bolivia
Bosnia and Herzegovina
Botswana
Brazil
Bulgaria
Burkina Faso
Cambodia
Cameroon
Canada
Central Europe and the Baltics
Chile
China
Colombia
Congo, Dem. Rep.
Congo, Rep.
Costa Rica
Cote d'Ivoire
Croatia
Cuba
Czech Republic
Denmark
Djibouti
Early-demographic dividend
East Asia & Pacific
East Asia & Pacific (excluding high income)
East Asia & Pacific (IDA & IBRD countries)
Egypt, Arab Rep.
Estonia
Ethiopia
Euro area
Europe & Central Asia
Europe & Central Asia (excluding high income)
Europe & Central Asia (IDA & IBRD countries)
European Union
Finland
Fragile and conflict affected situations
France
Gabon
Georgia
Germany
Ghana
Greece
Heavily indebted poor countries (HIPC)
High income
Hungary
IBRD only
IDA & IBRD total
IDA blend
IDA only
IDA total
India
Indonesia
Iran, Islamic Rep.
Iraq
Ireland
Israel
Italy
Japan
Jordan
Kazakhstan
Kenya
Korea, Rep.
Kyrgyz Republic
Late-demographic dividend
Latin America & Caribbean
Latin America & Caribbean (excluding high income)
Latin America & the Caribbean (IDA & IBRD countries)
Latvia
Least developed countries: UN classification
Lithuania
Low & middle income
Low income
Lower middle income
Luxembourg
Macedonia, FYR
Madagascar
Malawi
Malaysia
Mali
Mauritania
Mexico
Middle East & North Africa
Middle East & North Africa (excluding high income)
Middle East & North Africa (IDA & IBRD countries)
Middle income
Moldova
Mongolia
Morocco
Mozambique
Myanmar
Namibia
Netherlands
New Zealand
Nigeria
North America
Norway
OECD members
Other small states
Pakistan
Peru
Philippines
Poland
Portugal
Post-demographic dividend
Pre-demographic dividend
Romania
Russian Federation
Saudi Arabia
Senegal
Serbia
Slovak Republic
Slovenia
Small states
South Africa
South Asia
South Asia (IDA & IBRD)
Spain
Sri Lanka
Sub-Saharan Africa
Sub-Saharan Africa (excluding high income)
Sub-Saharan Africa (IDA & IBRD countries)
Sudan
Swaziland
Sweden
Switzerland
Syrian Arab Republic
Tajikistan
Tanzania
Thailand
Tunisia
Turkey
Turkmenistan
Uganda
Ukraine
United Kingdom
United States
Upper middle income
Uruguay
Uzbekistan
Venezuela, RB
Vietnam
World
Zambia
Zimbabwe
Timeline:
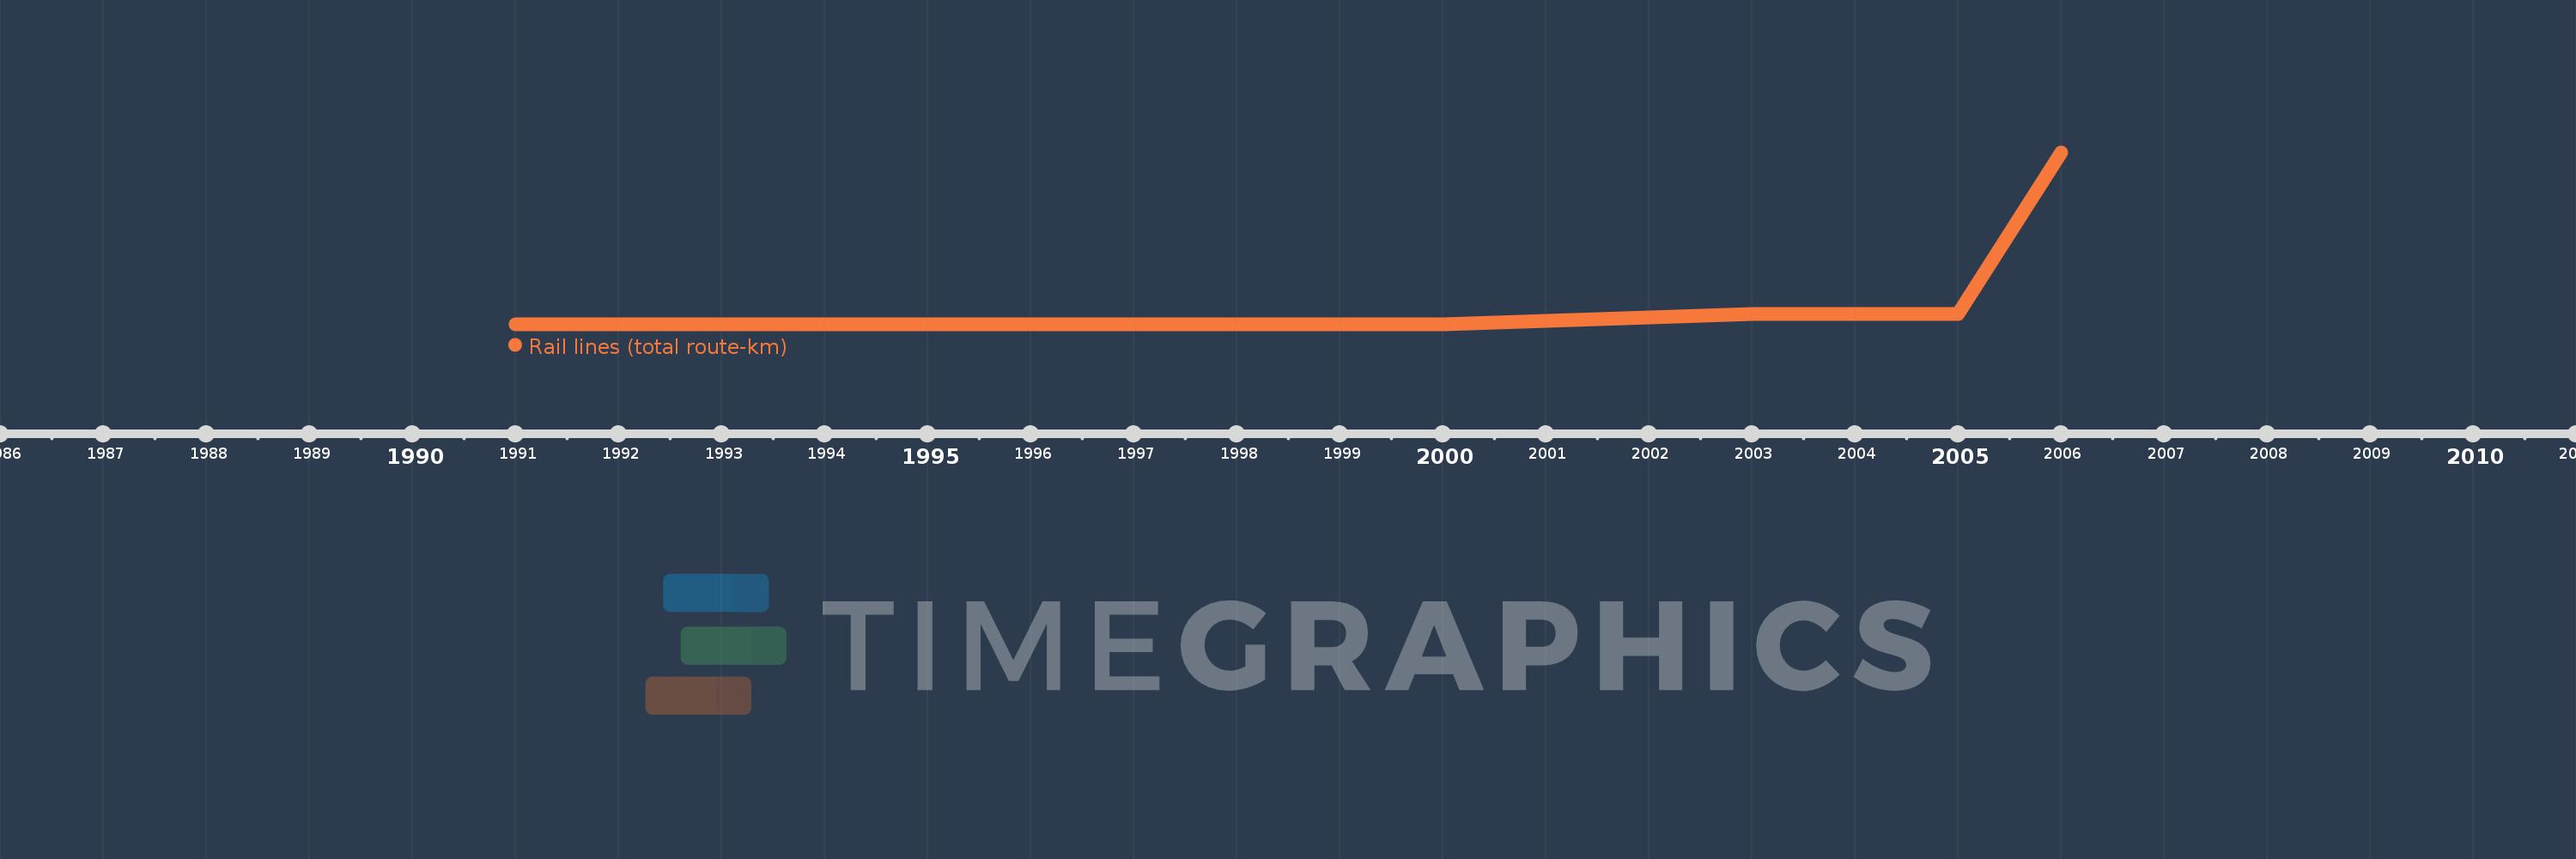
This timeline shows a graph from
1991
to
2006
of Cambodia. No data until
1990
. Number of actual observations by date:
14
.
Source name:
World Development Indicators
Source organization:
World Bank, Transportation, Water, and Information and Communications Technologies Department, Transport Division.
Categories, topics:
Infrastructure
Last updated:
apr 23, 2017
Indicators value changes by year
Meaning:
604.071
Minimum:
600.0
jan 1, 1991
Maximum:
650.0
jan 1, 2006
At the date of observation
Value
Absolute change
Change from the previous value
jan 1, 1991
600.0
+600.0
0.0%
jan 1, 1992
600.0
0.0
0.0%
jan 1, 1993
600.0
0.0
0.0%
jan 1, 1994
600.0
0.0
0.0%
jan 1, 1995
600.0
0.0
0.0%
jan 1, 1996
600.0
0.0
0.0%
jan 1, 1997
600.0
0.0
0.0%
jan 1, 1998
600.0
0.0
0.0%
jan 1, 1999
600.0
0.0
0.0%
jan 1, 2000
600.0
0.0
0.0%
jan 1, 2001
601.0
+1.0
0.17%
jan 1, 2003
603.0
+2.0
0.33%
jan 1, 2005
603.0
0.0
0.0%
jan 1, 2006
650.0
+47.0
7.79%
Ranking of countries by current statistics by years
About & Feedback
Terms
Privacy
FAQ
Support 24/7
Cabinet
Get premium
Donate
The service accepts bank transfer (ACH, Wire) or cards (Visa, MasterCard, etc). Processed by Stripe.
Secured with SSL