33
/
AIzaSyB4mHJ5NPEv-XzF7P6NDYXjlkCWaeKw5bc
November 30, 2025
96060
Burundi
BDI
true
2
1
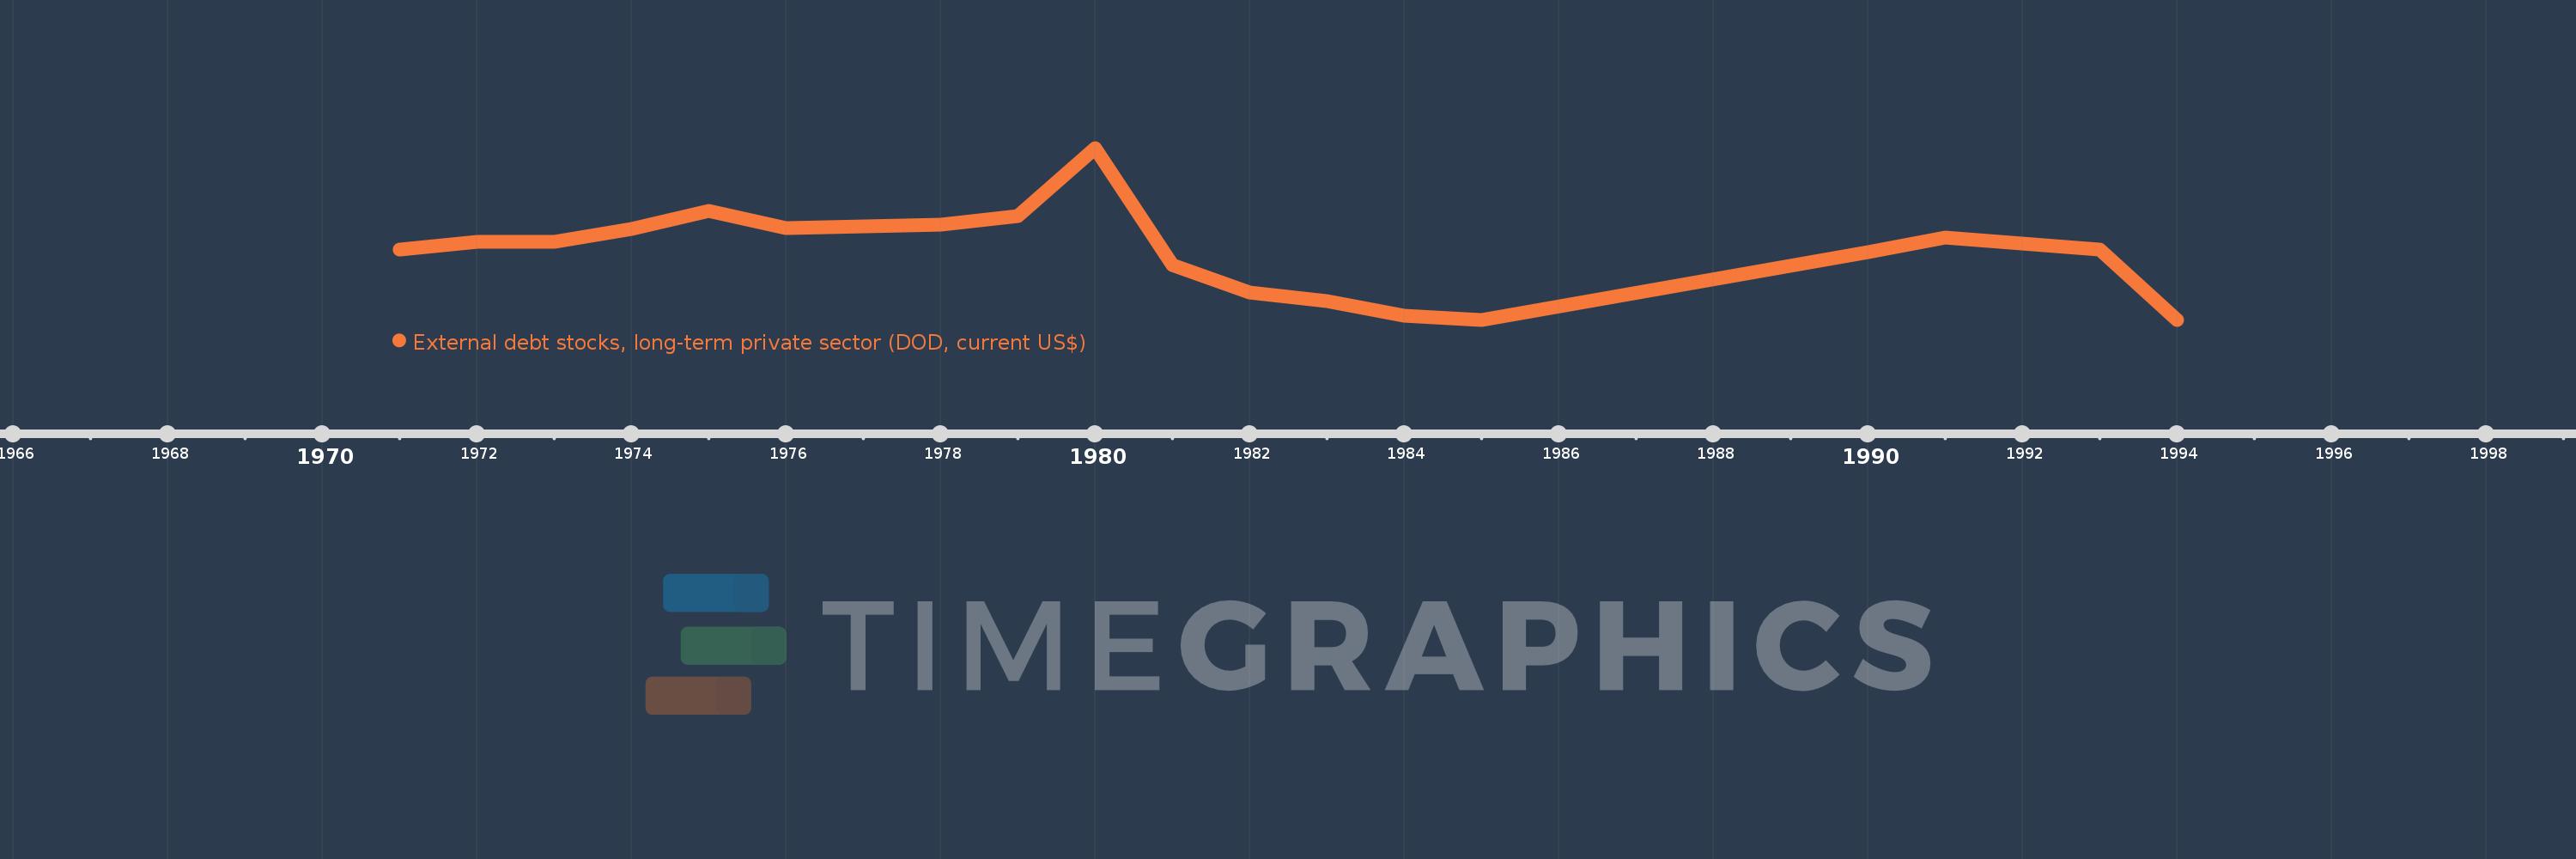
External debt stocks, long-term private sector (DOD, current US$)
1994,1993,1992,1991,1990,1985,1984,1983,1982,1981,1980,1979,1978,1977,1976,1975,1974,1973,1972,1971