33
/
AIzaSyB4mHJ5NPEv-XzF7P6NDYXjlkCWaeKw5bc
November 30, 2025
96043
Burundi
BDI
true
2
1
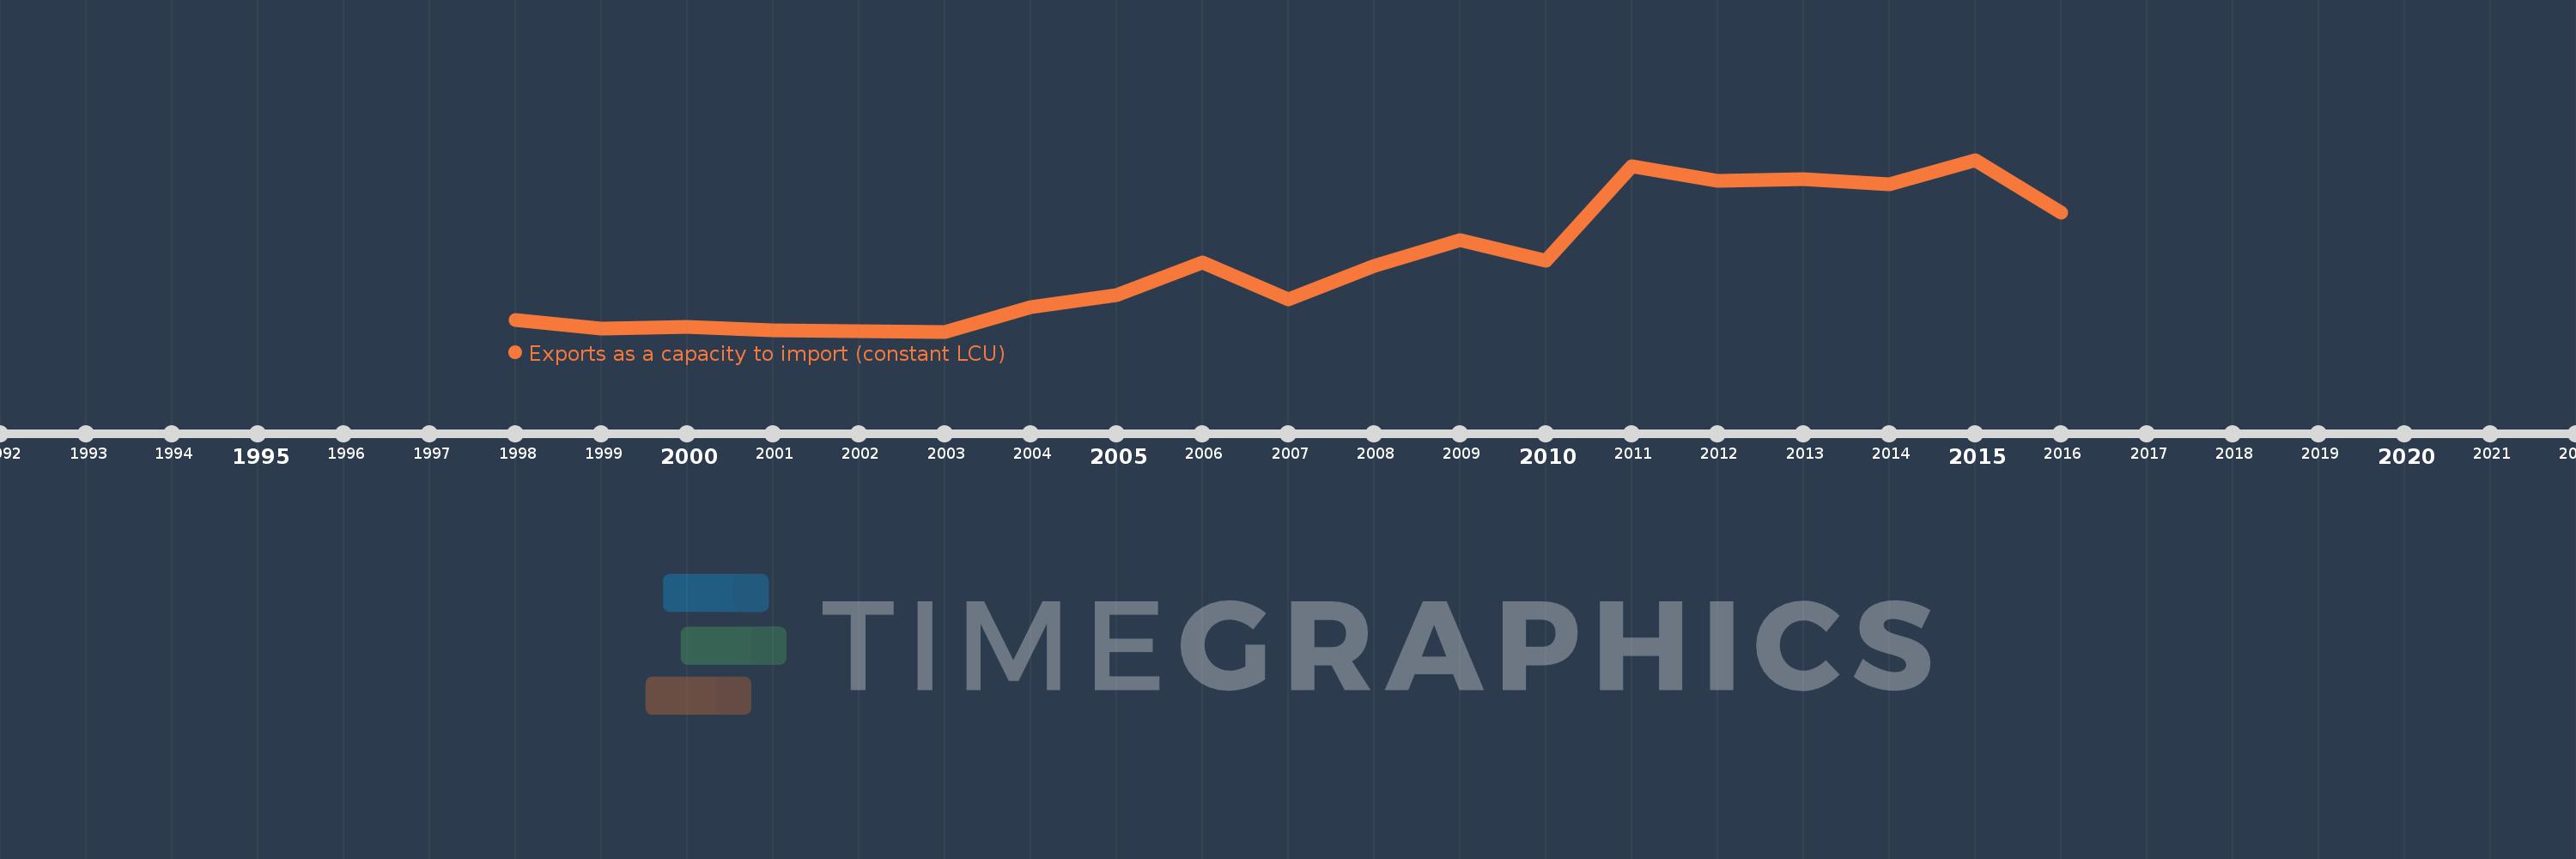
Exports as a capacity to import (constant LCU)
2016,2015,2014,2013,2012,2011,2010,2009,2008,2007,2006,2005,2004,2003,2002,2001,2000,1999,1998
Create a timeline
Public Timelines
For education
For educational institutions
For teachers
For students
Cabinet
For educational institutions
For teachers
For students
Open cabinet
FAQ
Close
Create a timeline
Public timelines
FAQ
About & Feedback
Terms
Privacy
FAQ
Support 24/7
Cabinet
Get premium
Donate
Download
Global statistics library
→
Burundi
→
Exports as a capacity to import (constant LCU)
This statistics in other country:
Albania
Algeria
Angola
Antigua and Barbuda
Argentina
Armenia
Australia
Austria
Azerbaijan
Bahamas, The
Bahrain
Bangladesh
Barbados
Belarus
Belgium
Belize
Benin
Bhutan
Bolivia
Bosnia and Herzegovina
Botswana
Brazil
Brunei Darussalam
Bulgaria
Burkina Faso
Burundi
Cabo Verde
Cambodia
Cameroon
Canada
Chad
Chile
Colombia
Comoros
Congo, Dem. Rep.
Congo, Rep.
Costa Rica
Cote d'Ivoire
Croatia
Cuba
Cyprus
Czech Republic
Denmark
Djibouti
Dominican Republic
Ecuador
Egypt, Arab Rep.
El Salvador
Equatorial Guinea
Eritrea
Estonia
Ethiopia
Fiji
Finland
France
Gabon
Gambia, The
Georgia
Germany
Ghana
Greece
Guatemala
Guinea
Guinea-Bissau
Haiti
Honduras
Hong Kong SAR, China
Hungary
Iceland
India
Indonesia
Iran, Islamic Rep.
Ireland
Israel
Italy
Jamaica
Japan
Jordan
Kazakhstan
Kenya
Korea, Rep.
Kosovo
Kuwait
Kyrgyz Republic
Lao PDR
Latvia
Lebanon
Liberia
Libya
Lithuania
Luxembourg
Macao SAR, China
Macedonia, FYR
Madagascar
Malawi
Malaysia
Mali
Malta
Mauritania
Mauritius
Mexico
Moldova
Mongolia
Montenegro
Morocco
Mozambique
Myanmar
Namibia
Nepal
Netherlands
New Zealand
Nicaragua
Niger
Nigeria
Norway
Oman
Pakistan
Panama
Papua New Guinea
Paraguay
Peru
Philippines
Poland
Portugal
Puerto Rico
Qatar
Romania
Russian Federation
Rwanda
Samoa
Saudi Arabia
Senegal
Serbia
Seychelles
Sierra Leone
Singapore
Slovak Republic
Slovenia
Somalia
South Africa
South Sudan
Spain
Sri Lanka
Sudan
Suriname
Swaziland
Sweden
Switzerland
Syrian Arab Republic
Tajikistan
Tanzania
Thailand
Timor-Leste
Togo
Trinidad and Tobago
Tunisia
Turkey
Turkmenistan
Uganda
Ukraine
United Arab Emirates
United Kingdom
United States
Uruguay
Uzbekistan
Vanuatu
Venezuela, RB
Vietnam
West Bank and Gaza
Zambia
Zimbabwe
Timeline:
This timeline shows a graph from
1998
to
2016
of Burundi. No data until
1997
. Number of actual observations by date:
19
.
Source name:
World Development Indicators
Source organization:
World Bank national accounts data, and OECD National Accounts data files.
Categories, topics:
Economy & Growth, Trade
Last updated:
apr 23, 2017
Indicators value changes by year
Meaning:
99.411 bln
Minimum:
38.568 bln
jan 1, 2003
Maximum:
189.269 bln
jan 1, 2015
At the date of observation
Value
Absolute change
Change from the previous value
jan 1, 1998
48.769 bln
+48.769 bln
0.0%
jan 1, 1999
40.862 bln
-7.907 bln
-16.21%
jan 1, 2000
42.947 bln
+2.085 bln
5.1%
jan 1, 2001
39.673 bln
-3.274 bln
-7.62%
jan 1, 2002
39.168 bln
-504.832 mln
-1.27%
jan 1, 2003
38.568 bln
-599.902 mln
-1.53%
jan 1, 2004
59.751 bln
+21.183 bln
54.92%
jan 1, 2005
70.567 bln
+10.816 bln
18.1%
jan 1, 2006
99.119 bln
+28.552 bln
40.46%
jan 1, 2007
66.969 bln
-32.15 bln
-32.44%
jan 1, 2008
95.989 bln
+29.019 bln
43.33%
jan 1, 2009
118.588 bln
+22.599 bln
23.54%
jan 1, 2010
100.689 bln
-17.899 bln
-15.09%
jan 1, 2011
183.612 bln
+82.923 bln
82.36%
jan 1, 2012
171.138 bln
-12.473 bln
-6.79%
jan 1, 2013
172.129 bln
+990.157 mln
0.58%
jan 1, 2014
168.075 bln
-4.054 bln
-2.36%
jan 1, 2015
189.269 bln
+21.194 bln
12.61%
jan 1, 2016
142.921 bln
-46.347 bln
-24.49%
Ranking of countries by current statistics by years
About & Feedback
Terms
Privacy
FAQ
Support 24/7
Cabinet
Get premium
Donate
The service accepts bank transfer (ACH, Wire) or cards (Visa, MasterCard, etc). Processed by Stripe.
Secured with SSL