33
/
AIzaSyB4mHJ5NPEv-XzF7P6NDYXjlkCWaeKw5bc
November 30, 2025
95474
Burkina Faso
BFA
true
2
1
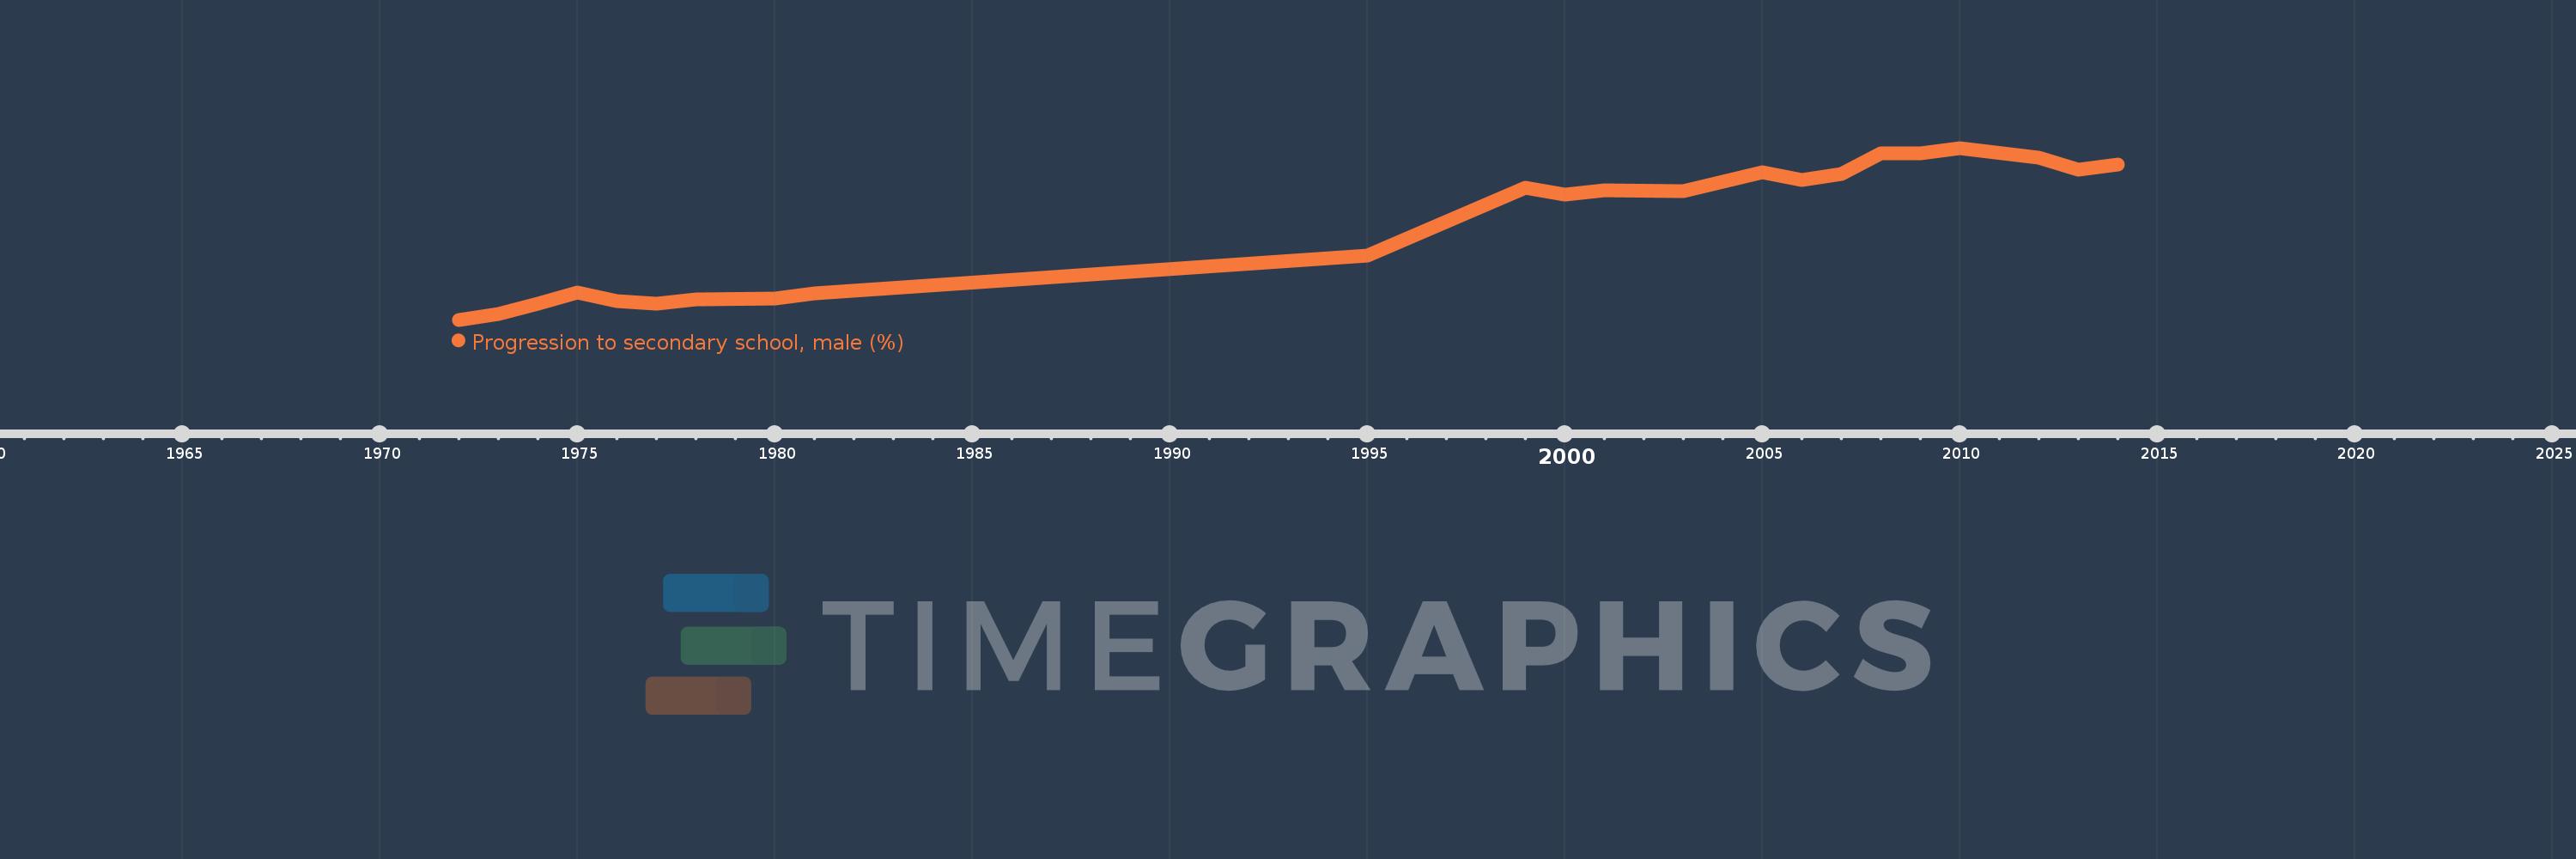
Progression to secondary school, male (%)
2014,2013,2012,2010,2009,2008,2007,2006,2005,2003,2001,2000,1999,1995,1981,1980,1978,1977,1976,1975,1974,1973,1972